At The Eyewall, our ultimate goal is to make this the premier site or newsletter for weather and forecast information. How we get there involves some experimentation more than just forcing a post for post’s sake. Today we’re going to tackle a relatively small forecast bust that occurred in the Upper Midwest last week that speaks to the difficulties of forecasting sometimes.
In brief: Below, I show a case in Minnesota last week where the forecast sort of misplaced the higher-end snow totals. While modeling had been generally supportive of the higher snow totals along and north of I-94, which goes through Minneapolis, the highest totals actually ended up between Minneapolis and Mankato, south of I-94. It wasn’t a busted forecast in a classic sense, but it offered an opportunity to assess how models did. And wouldn’t you know it, the European AI modeling seemed to be the most consistent in identifying the riskiest areas for highest precip totals as being south of I-94.
If you read every one of our posts every day throughout hurricane season (bless your heart and thank you if you did), you would have noticed a bit of a change in “tone” or frequency of us discussing things like AI modeling or the ICON model. One post in particular stands out regarding Hurricane Francine.
I’ve been professionally forecasting weather for over 20 years now, and much like a generation of forecasters before me witnessed in their careers, I firmly believe we are witnessing one of the most consequential forecasting “revolutions,” if you will in a very long time. There have always been new or tweaked models intended to improve forecast output. Things change, they get better, the science moves forward. But what we are seeing now is what I believe to be a legitimate disruption. AI, machine learning, and more efficient computer power are leading to a new wave of models, new ways of developing models, and a turnaround time on these new tools that’s lightning fast compared to history. The European AIFS model is barely 18 months old, and it’s already become an absolutely essential tool in the toolkit. Every few weeks a company like NVIDIA or Google or a smaller firm comes forward and announces some breakthrough they’ve made in forecasting using AI and machine learning. Of course, science by press release tells us nothing useful. But as some of this stuff gets integrated and made available to forecasters, it seems clear that the hype has some legitimacy.
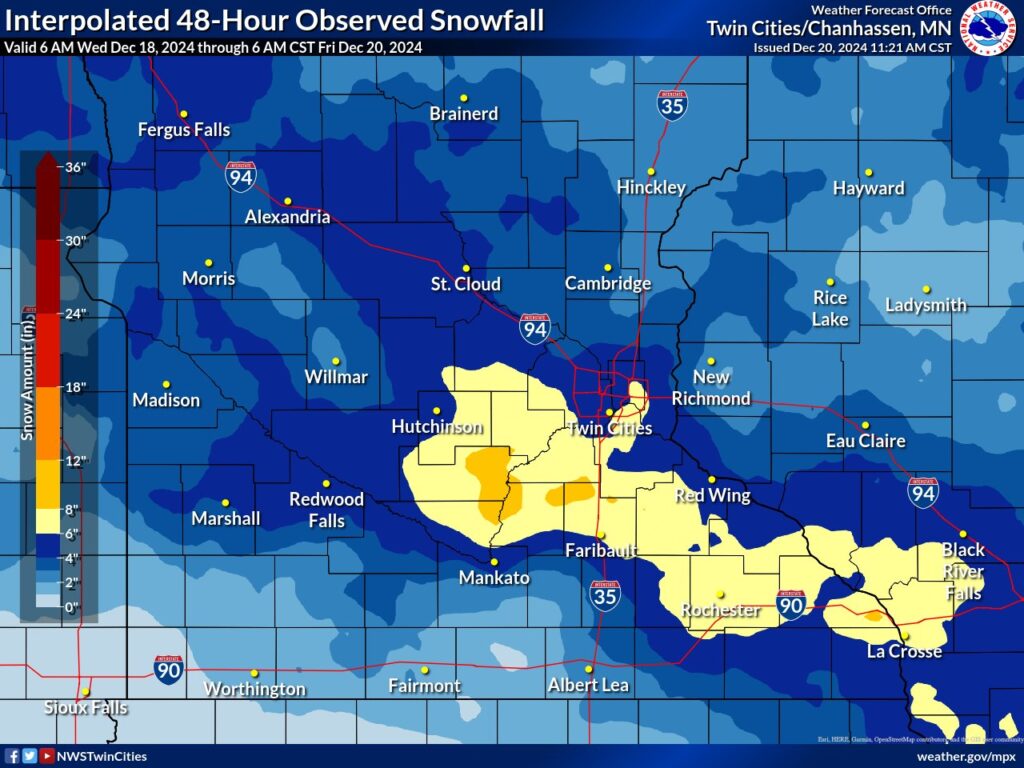
So what does this have to do with Minnesota? Well, I wanted to walk through the anatomy of a fairly minor forecast “bust” of sorts that occurred in Minnesota last week. I’m not going to throw anyone under the proverbial bus here; the NWS and others did a fine job overall messaging how this system would impact the region, and for the most part that’s what happened. But there were some surprises in how this unfolded, which were fairly small in terms of mathematical error or impacts but may have led to the perception of a fairly meaningful forecast bust.
Last Thursday, a storm system passing quickly through the state was expected to produce a widespread accumulating snow, which it did. The general thinking was that the highest totals would be north of I-94, which runs from Fargo through Alexandria (a favorite place of this author’s) and St. Cloud into the Twin Cities. There had been signs this was coming several days in advance. Last Monday, the NWS in the Twin Cities wrote this in their forecast discussion.
The general model consensus this morning has this swath setting up along & north of Interstate 94, but a few solutions do displace it totally to the south across southwest Minnesota & northern Iowa. So in summary, confidence continues to be very high in this system developing and for at least these Winter Weather Advisory-level snowfall amounts to occur, but is still low to medium on where the heaviest amounts are most likely across Minnesota & Wisconsin.
On Tuesday, their forecast discussion had not budged much at all, and the models had basically gotten in line with the idea of the highest precipitation totals along and north of I-94.
Models over the last 12 hours have trended slightly farther south, with the consensus track now placing the highest chances for snow along the Interstate 94 corridor. Still, chances still look good to expect 3-6″ of snow along and north of the Interstate 94 corridor of central MN & western WI, with amounts tapering off to around 1″ across southern MN.
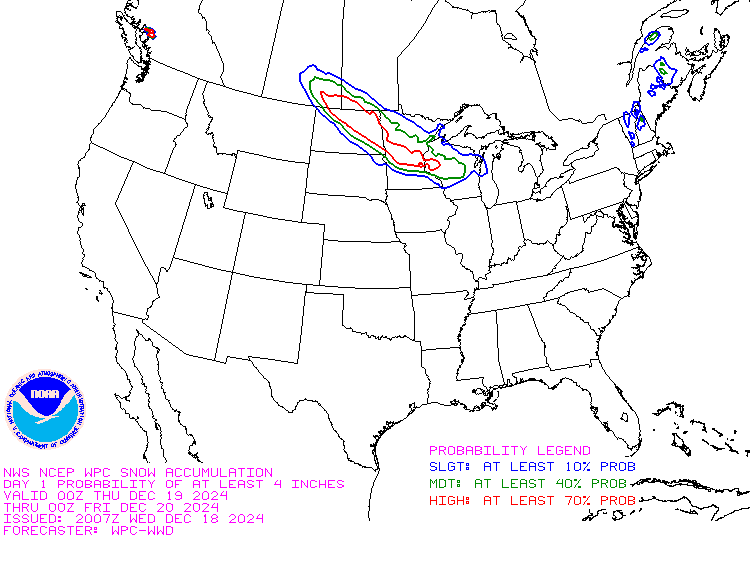
There was not a whole lot of change in tone on Wednesday either, other than the potential that a dry slot may cut down totals a bit further in southern Minnesota with some risk of getting into the Twin Cities. But in general, the consensus was for a 3-6″ snowfall in Minneapolis, with lesser amounts to the south. In fact, the Weather Prediction Center’s probability map of 4 inches or more of snow from that Wednesday showed about a 70 percent (high) chance of it occurring, and the geographically astute will notice it was very much along or north of I-94.
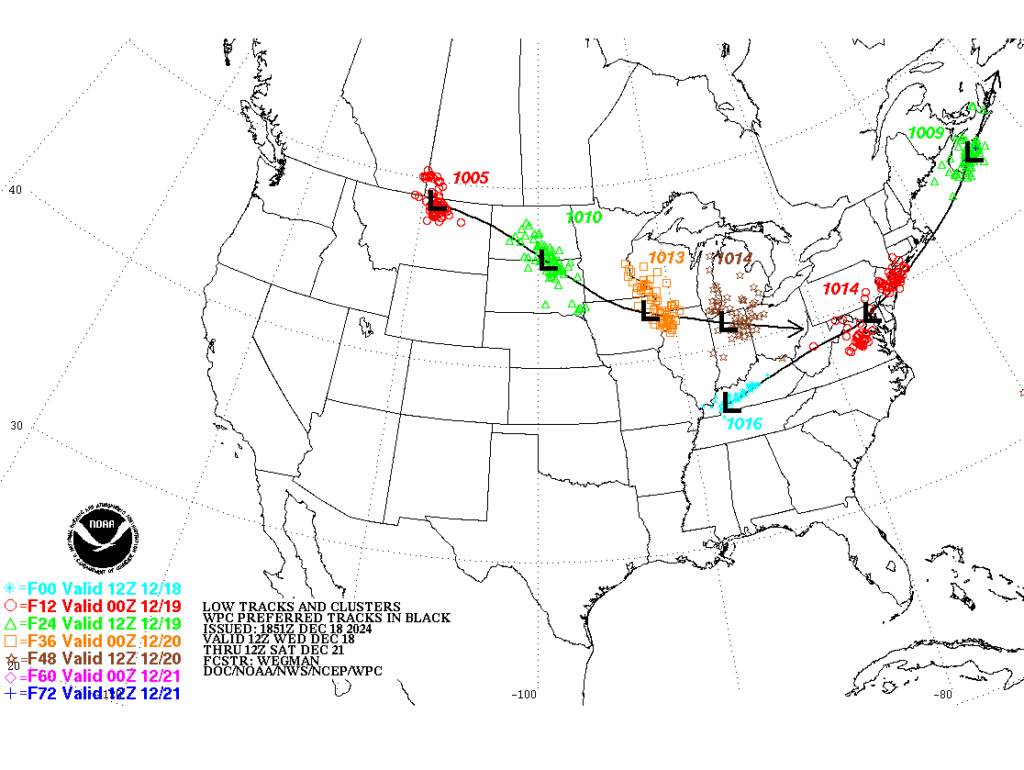
If you look at their forecast of where the low pressure system itself would track, you would see it going across southwest Minnesota and into northeast Iowa.
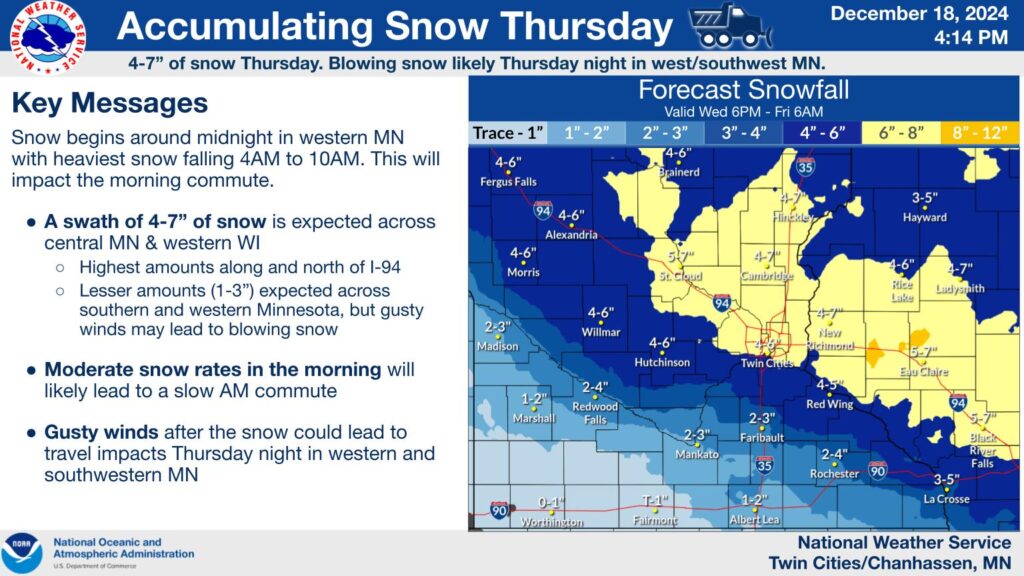
The colors indicate ensemble track clusters, while the solid black line and L’s indicates the WPC preferred track forecast. Putting this all together, the NWS issued this snowfall forecast below on Wednesday afternoon.
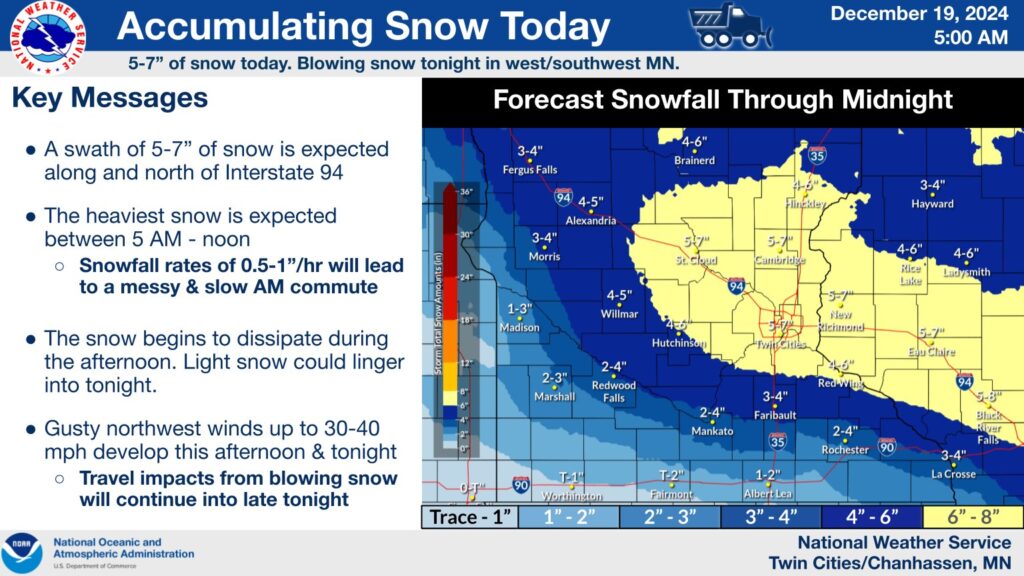
If you looked at this and lived in Mankato or Faribault, you expected just a few inches of snow. Faribault would actually end up closer to 8 inches of snow. Thursday’s forecast update did correctly nudge totals up there a bit.
When all was said and done, as you can see near the top of the post, the heaviest snows actually fell along and south of I-94, not north of I-94. So why did this happen, and did any models catch this?
Well, first off, the models did pretty well with the storm track forecast. As shown by the WPC above, the low pressure system tracked into northeast Iowa and across northern Illinois as expected. No surprises there.
Let’s take a look at the forecast precipitation from the models versus what verified. These are from 6z runs on Wednesday, meaning this would have been the newest likely data you’d have at your disposal making a forecast on Wednesday, early to mid-morning. I have included the ECMWF classic operational model, the ECMWF AIFS model, and the HRRR model, our higher resolution short-range model, as well as a verification based on radar estimates. Click to enlarge it.
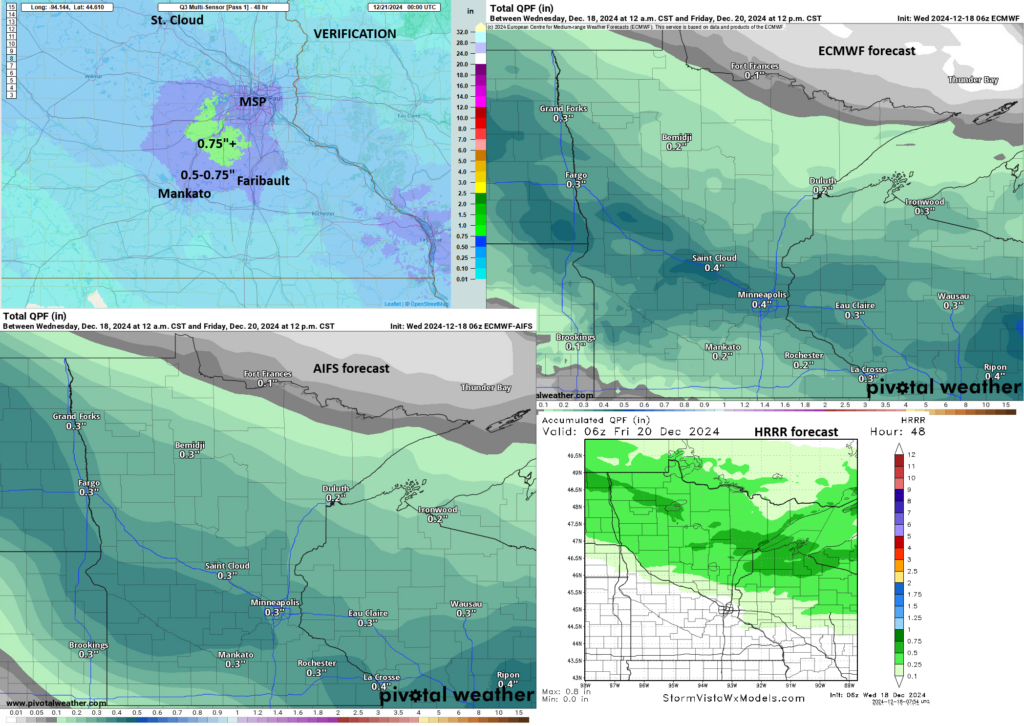
What’s up here? The Euro operational, which is generally anticipated to be the best in these scenarios had the corridor of highest precip totals right along I-94. The HRRR model was displaced way north of I-94. The AIFS model had the highest totals south and west of Minneapolis. The AIFS was actually quite consistent with that story. The ECMWF operational model had wobbled north with the highest totals on Wednesday before correcting back southward prior to the onset of the event on Thursday, with Wednesday evening’s model runs basically right in line with the AIFS model.
One of the things that continues to fascinate me about the AIFS model is that it often locks in on a solution with respect to a storm track and stay fixated on that. Let’s look at the 10 runs up to Thursday afternoon’s low placement. The ECMWF operational model had a couple issues. It was too far south early on, then corrected about 3 tiers of counties too far north before eventually settling back closer to the Iowa/Minnesota state line.
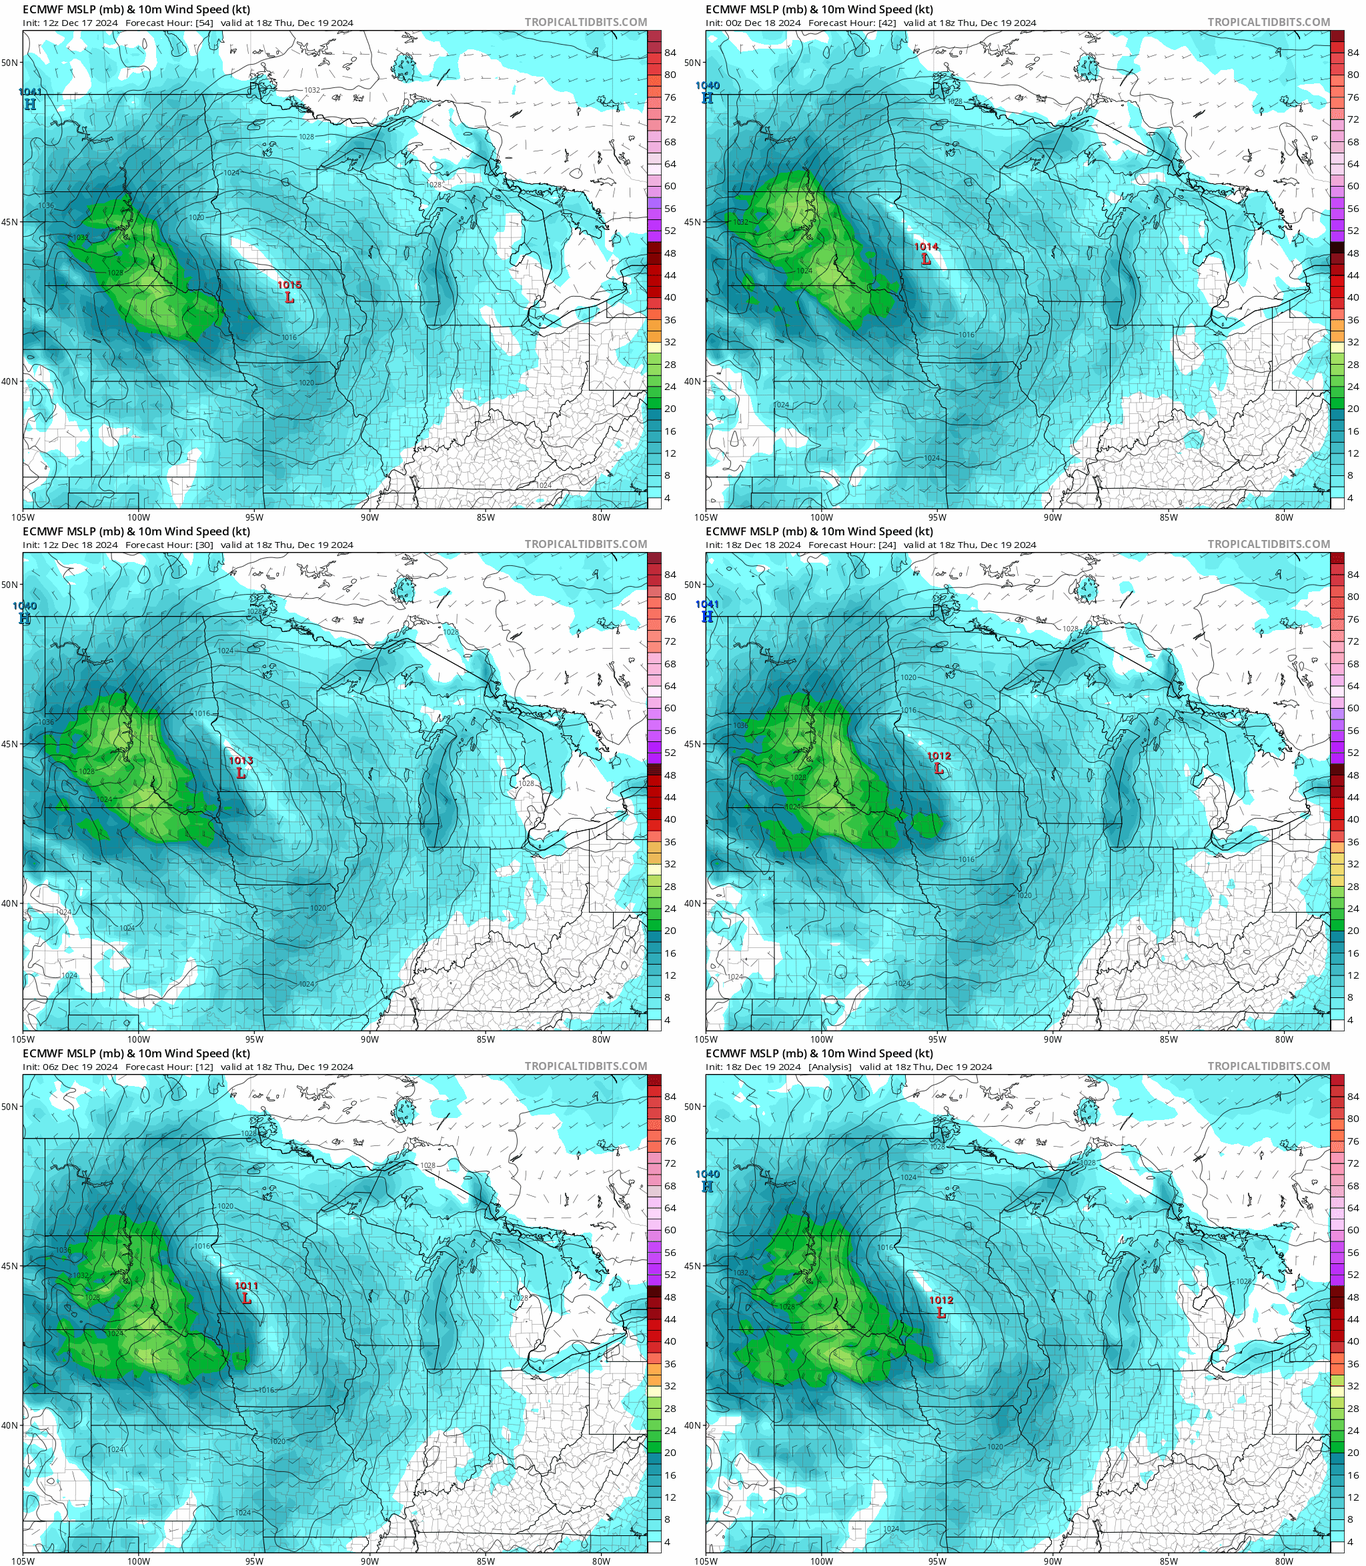
By no means would this be considered a “bad” forecast. You’re talking about a really well done forecast overall. Interestingly, if we look at the AIFS model, there was a lot less bouncing around that occurred. The forecast position of the low stayed basically within the upper 2 to 3 tiers of counties in Iowa.
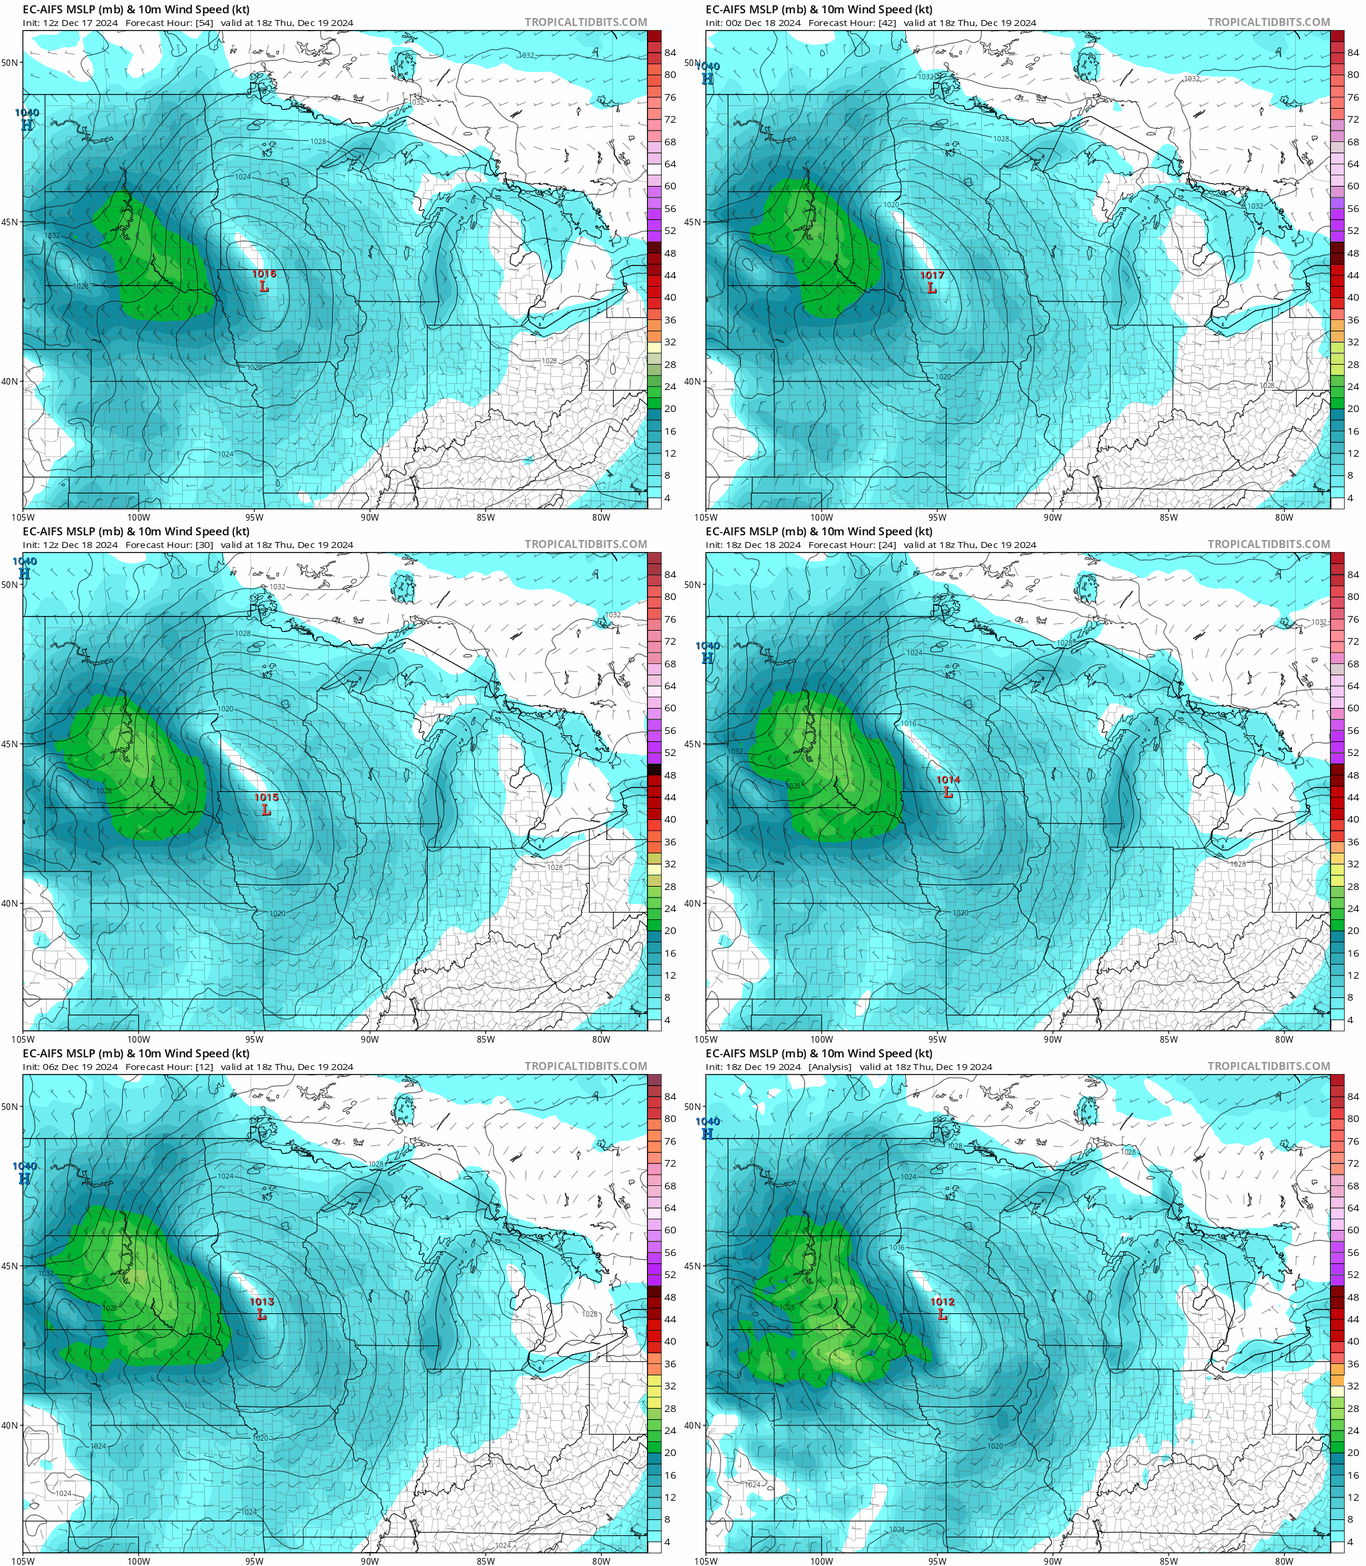
Generally speaking, the models seemed to do well with this system, but overall, it gets challenging in storms like this. If the exact track shifts 20-30 miles, you can take the best vertical velocity (or “lift,” rising air) in whatever direction that shift is in. I suspect that despite having a good forecast at a high level, the European operational model’s tendency to bounce around a bit possibly negatively impacted the forecast that had the higher totals generally near and north of Minneapolis as opposed to between Minneapolis and Mankato.
What is impressive to me is the continued performance of the AIFS model. It remains extremely imperfect from a specifics standpoint. In other words, because of how it runs, it’s usually unable to capture fine-scale features like precipitation maxes in major events, peak low pressure in a large hurricane, etc. But as a forecaster, I don’t need it to do that for me. What I need is generally accuracy, and then I can rely on other model data to fill in the gaps. In this instance, the AIFS was rather consistently showing the highest precipitation totals south of I-94, whereas its counterparts either flailed around a bit or didn’t catch on til the end. Even some of the highest resolution modeling we have to handle situations like this took until 12 hours or less before the system hit to adjust these totals farther to the south.
Anyway, to me this is another case where AI modeling could give you an edge. The challenge is feeling confident enough to buy in.
Very cool post! Do today’s models just use data from ballon’s launched every six hours? How in depth can the GOES etc get for temp/dewpt/mb to provide data for the models?
I thank you for all the information and as always learn something new! THANKS. jim
I thank you for all the information and as always learn something new! THANKS. jim
I flew “home” to Mpls on Thursday evening. It was definitely a Winter Wonderland! Growing up here, we’d always joke to never listen to the meteorologists because they were usually way off on their forecasts (especially snowfall amounts). Thanks for shedding some light on why it can be hard to forecast (and that was pre-AI).
Matt,
Thank you for sharing your thoughts on these models and forecasts. I absorb so much more information without the specter of a hurricane bearing down on us!
Alyce
Gulf Shores
Good stuff Matt! Thanks and Happy Holidays!!