In brief: Tropical Storm Erin will pass north of the islands this weekend before likely beginning to turn north off the East Coast. Questions on the exact track remain that could influence impacts in various spots, so continued monitoring is recommended for the East Coast, Atlantic Canada, Bermuda, the Bahamas, and the northeast Caribbean. Invest 98L in the Gulf will probably produce mostly positive rainfall over South Texas tomorrow and Saturday.
Tropical Storm Erin
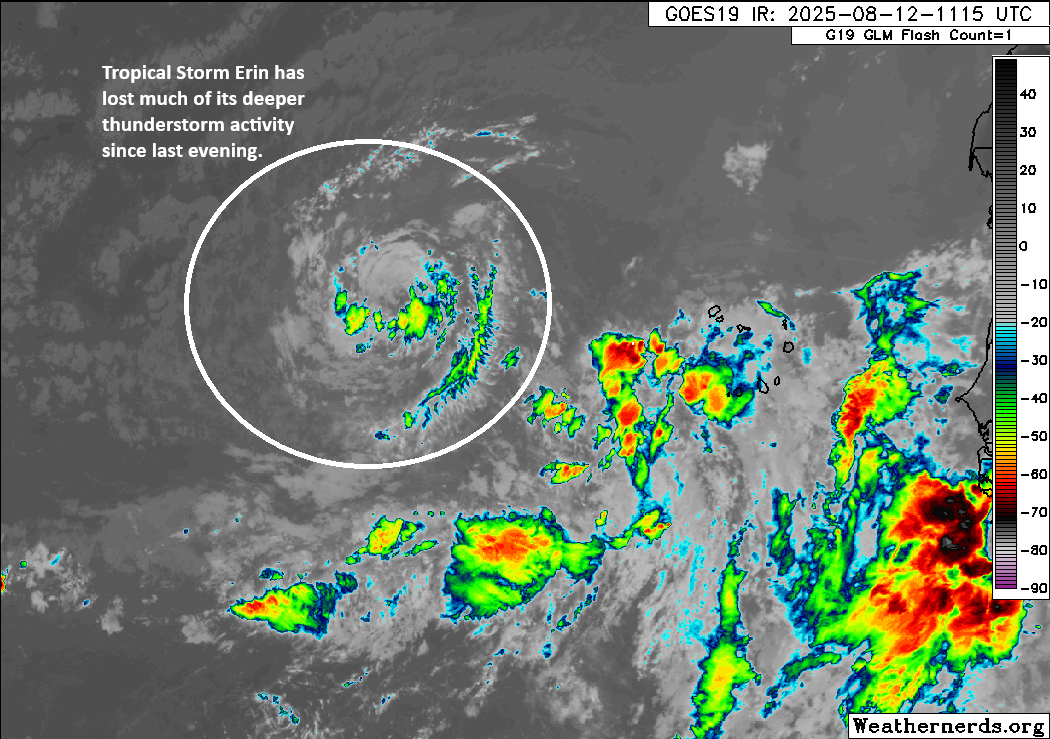
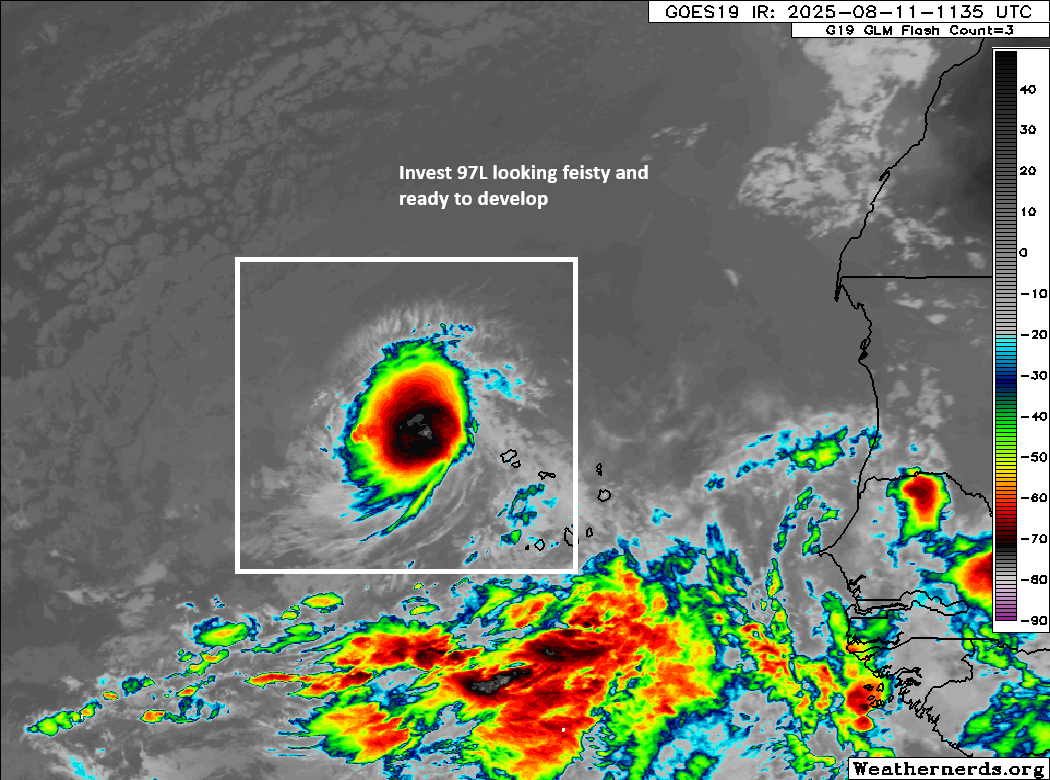
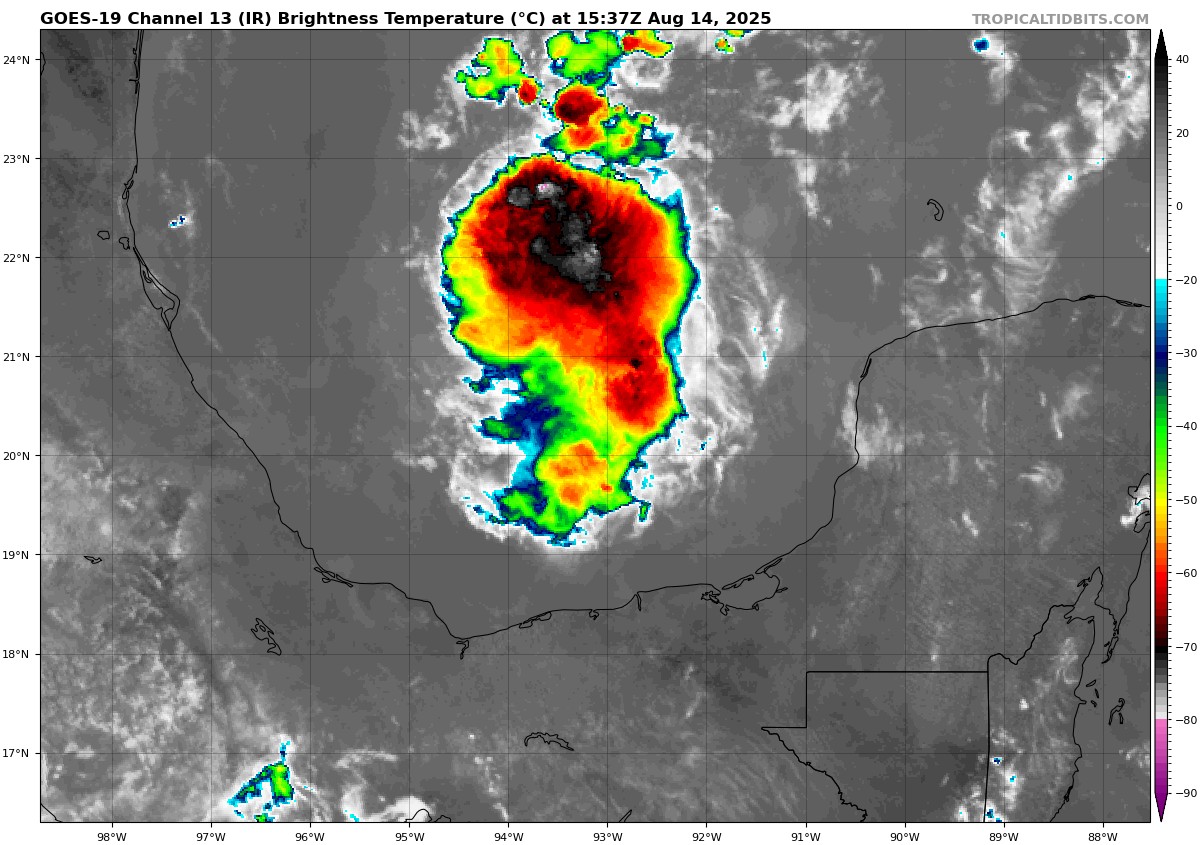
If we look at satellite this morning, it’s certainly the healthiest look Erin has had this week.
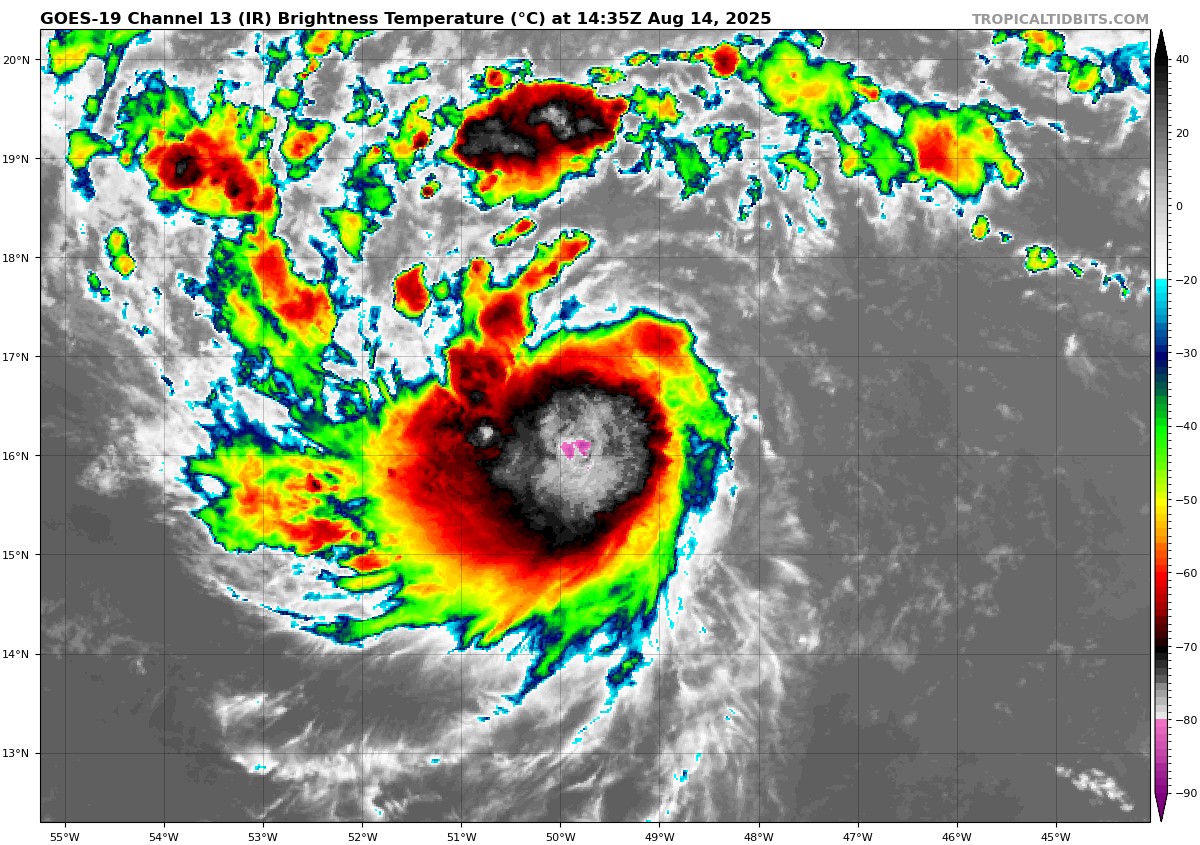
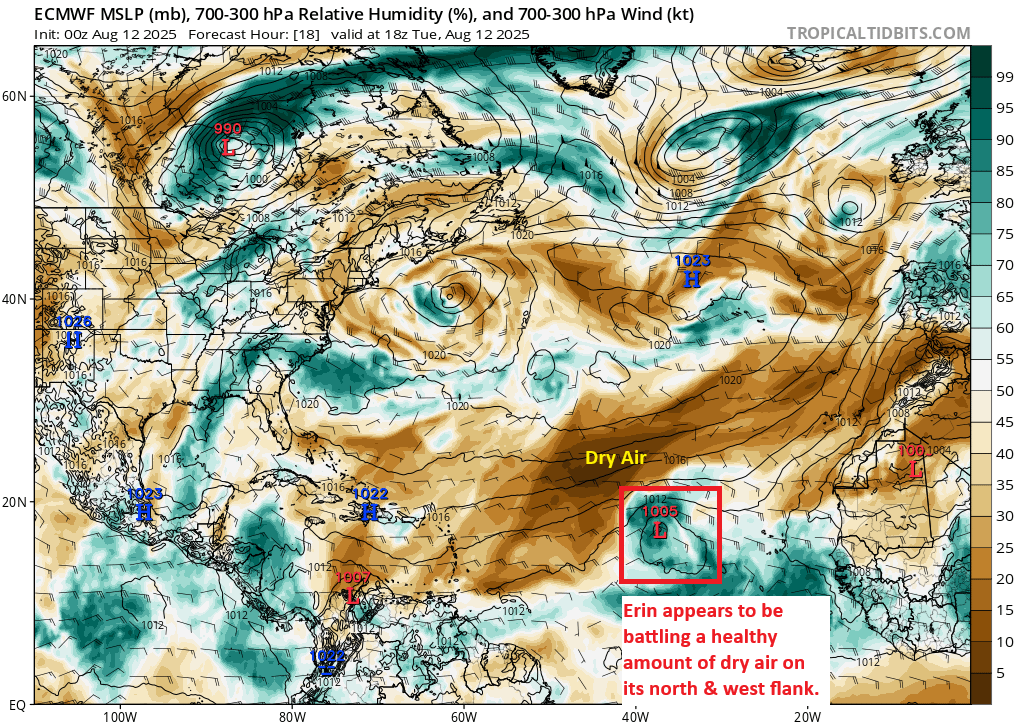
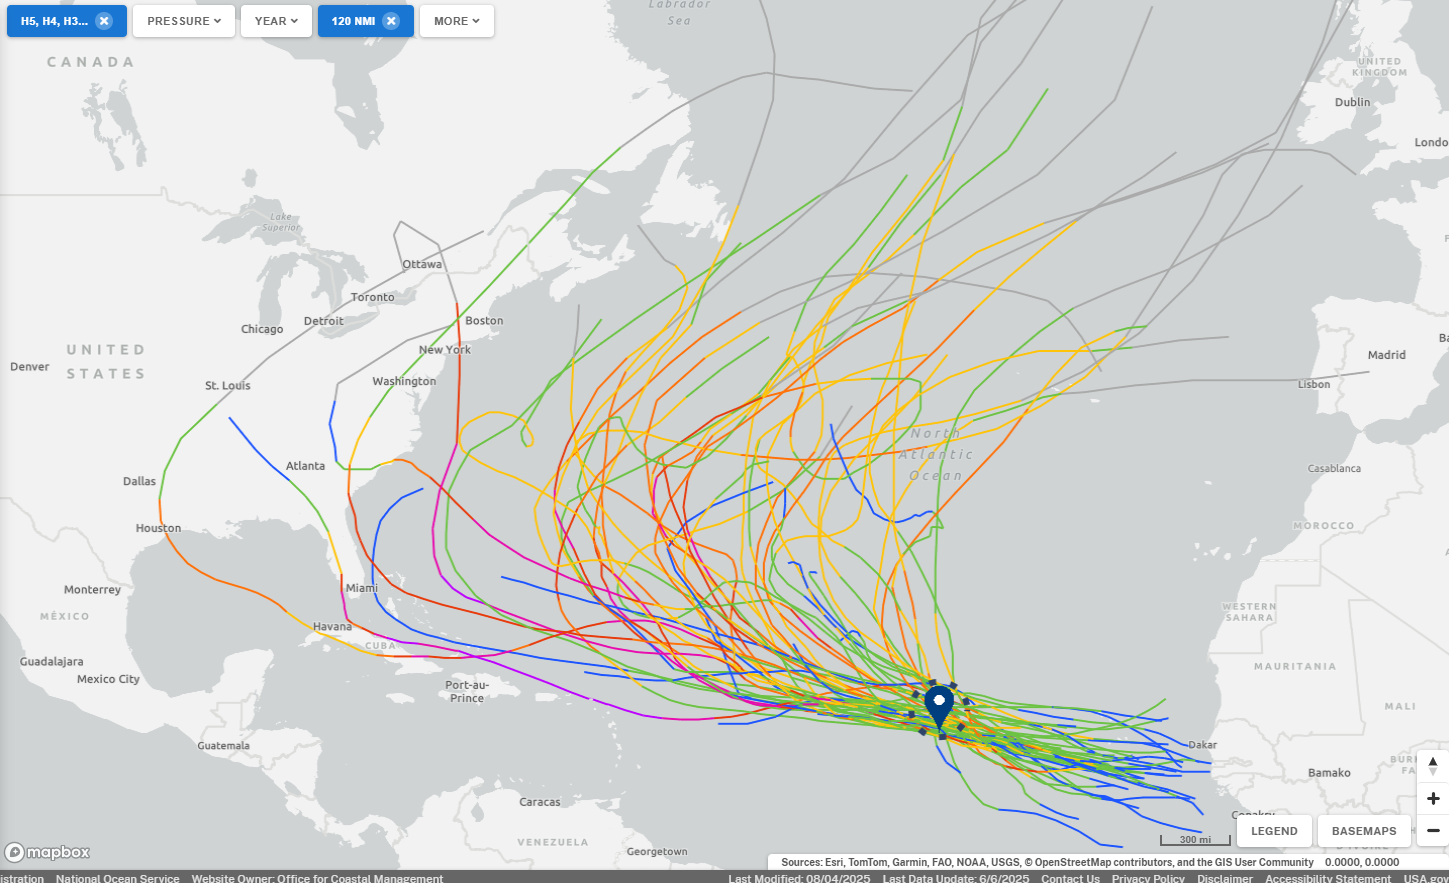
It’s clearly not the healthiest storm we’ve ever seen, but it’s doing enough to give the impression of slow intensification. As a result, Erin’s intensity is nudged up to 60 mph as of the 11 AM AST advisory. Using the latest map from Tomer Burg’s excellent site, it’s actually instructive to see what Erin has ahead of itself.
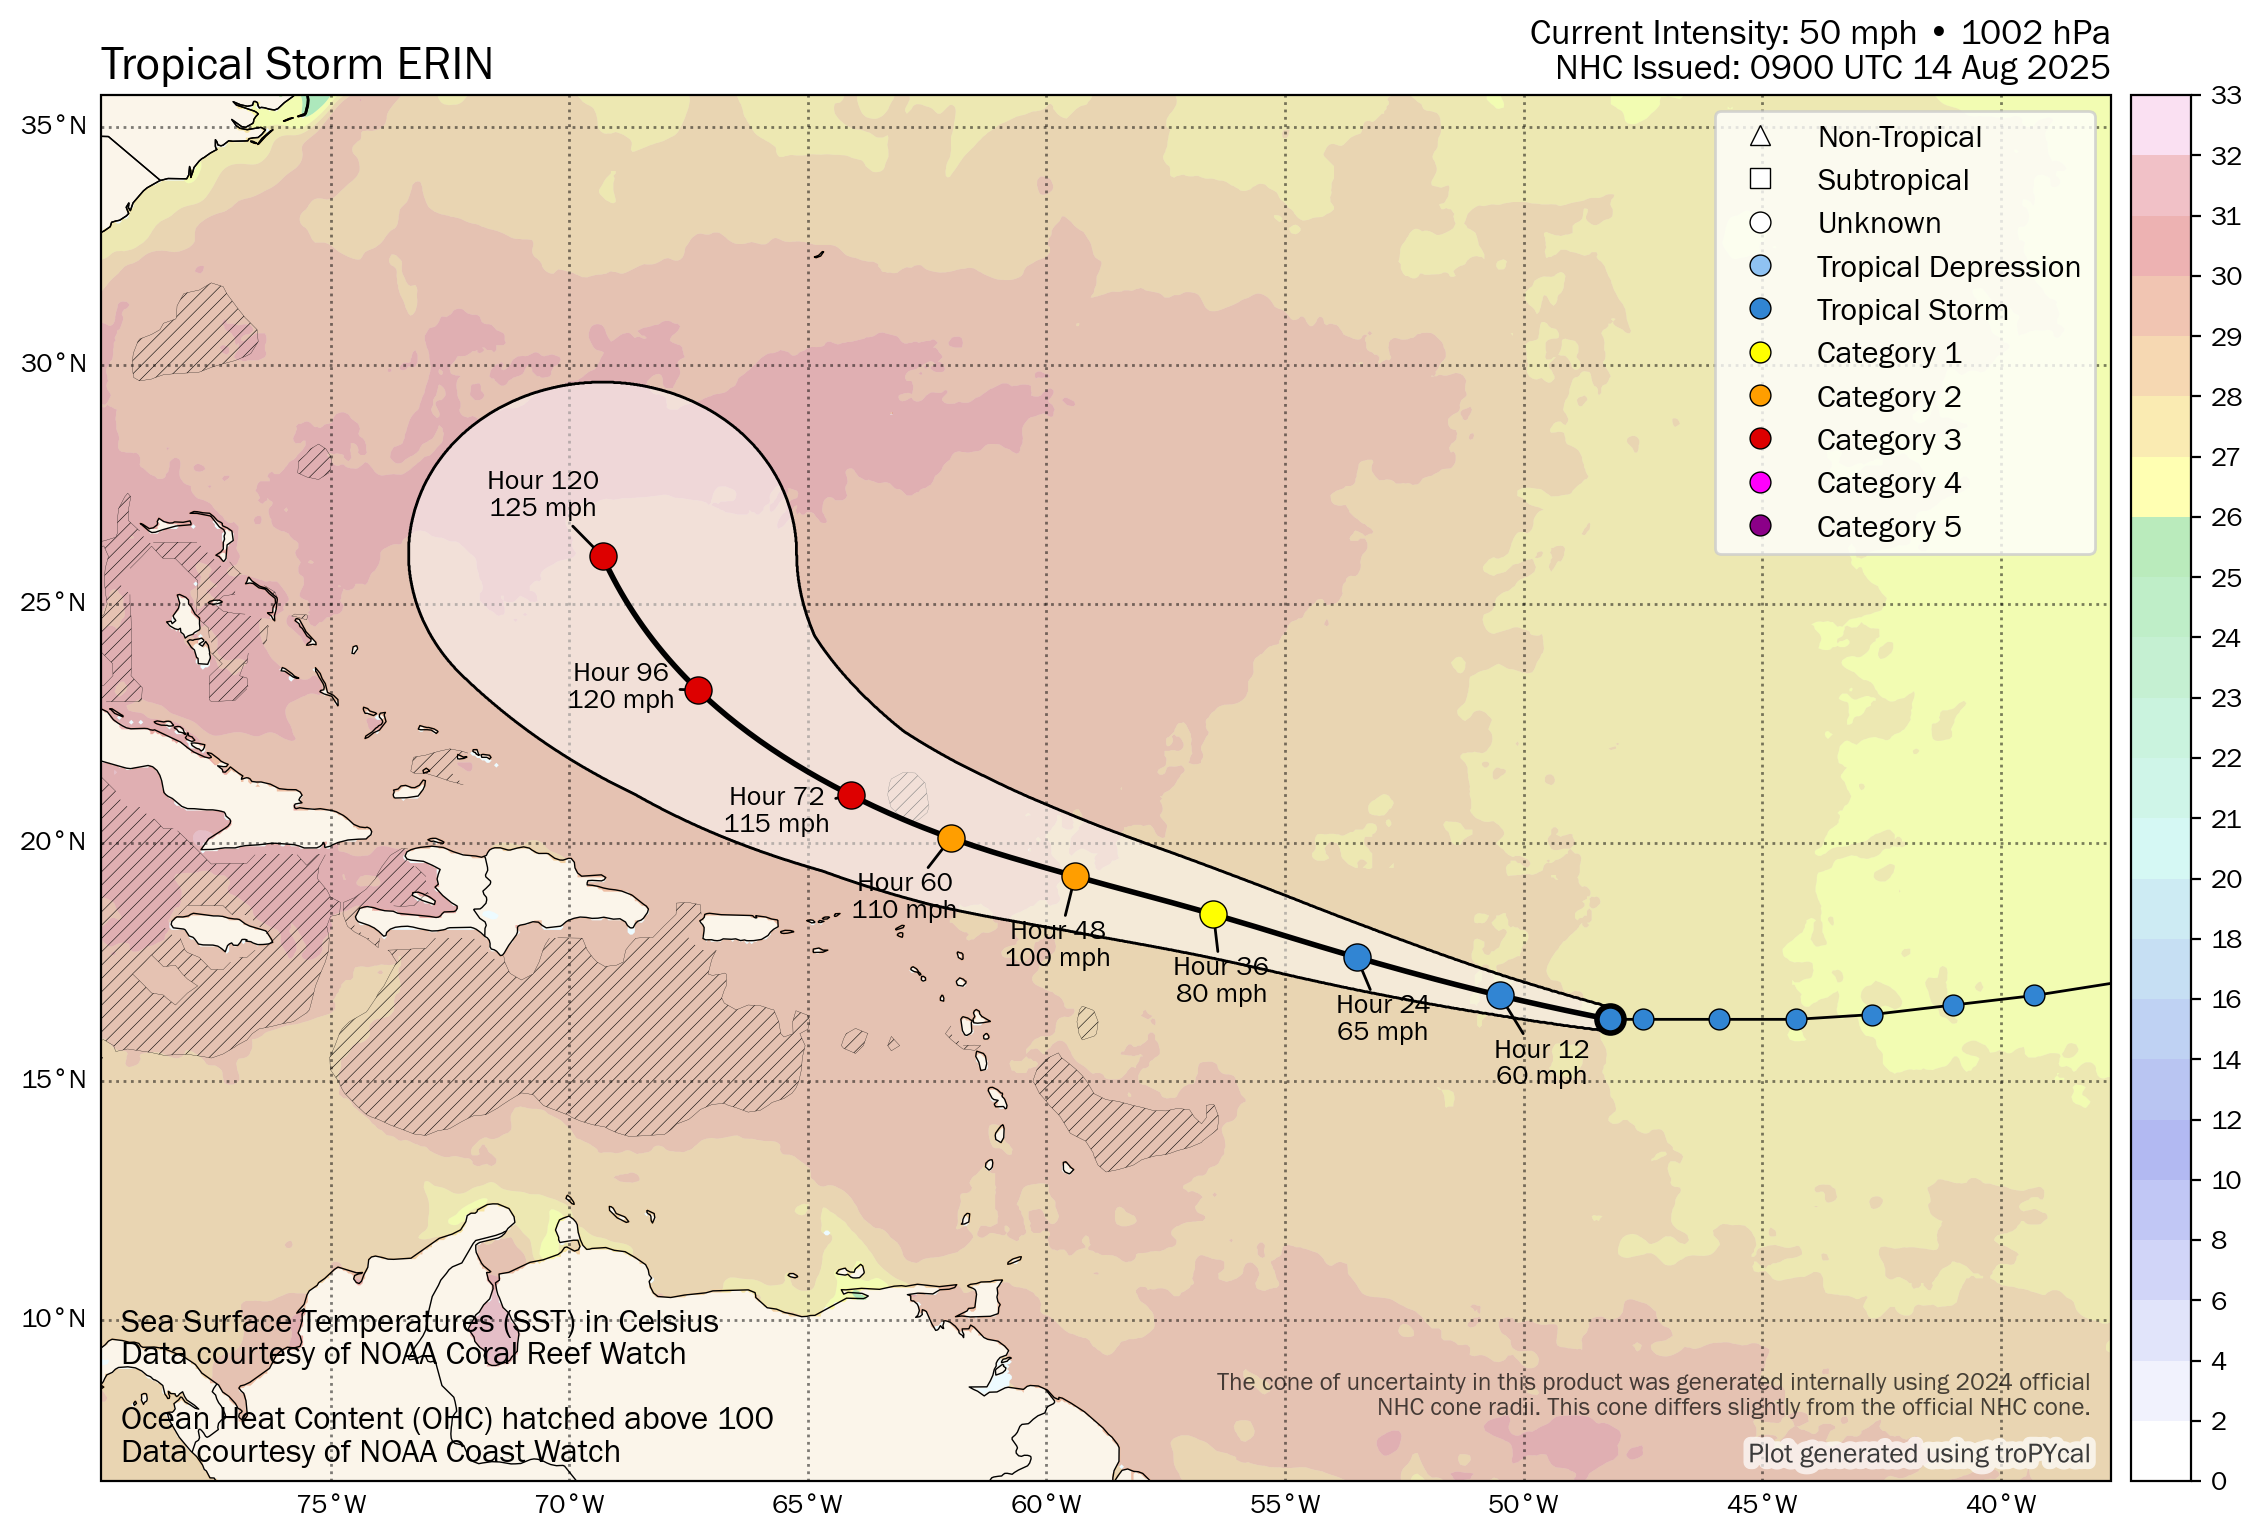
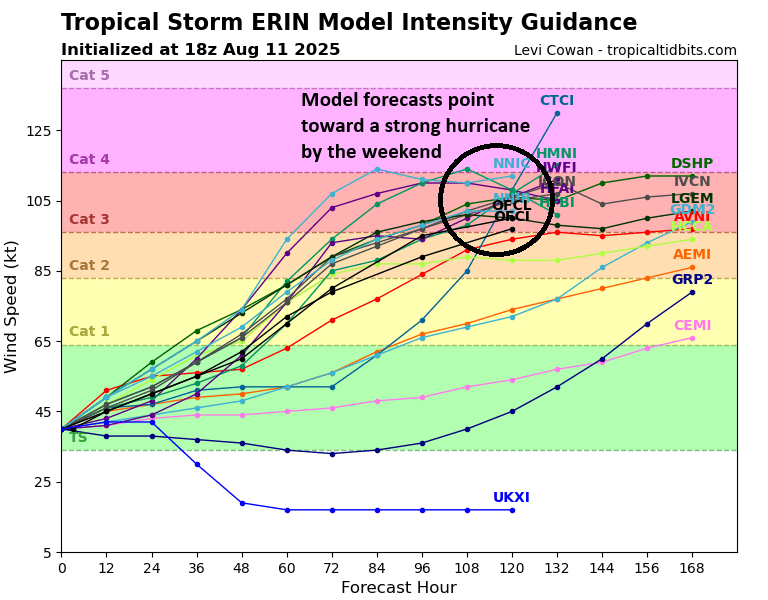
Erin is moving into an environment with very warm water temperatures, and it’s not going to exit that environment for at least 5 or 6 days. Erin should begin to tap into this environment over the next couple days, and it’s possible that we see a burst of rapid intensification at some point. Erin has not completely rid itself of dry air yet, so that may limit just how out of hand intensification can get. Whatever the case, given a favorable upper environment and warm water temps, one would expect Erin to start tapping the accelerator a bit today and tomorrow. After Friday and into this weekend, the storm may begin to “feel” some added wind shear to the west. This could slow the intensification rate a good bit. The models love this storm, and they’re quite aggressive with intensification over the next 3 to 4 days, with most pinning Erin at Cat 3 or above.
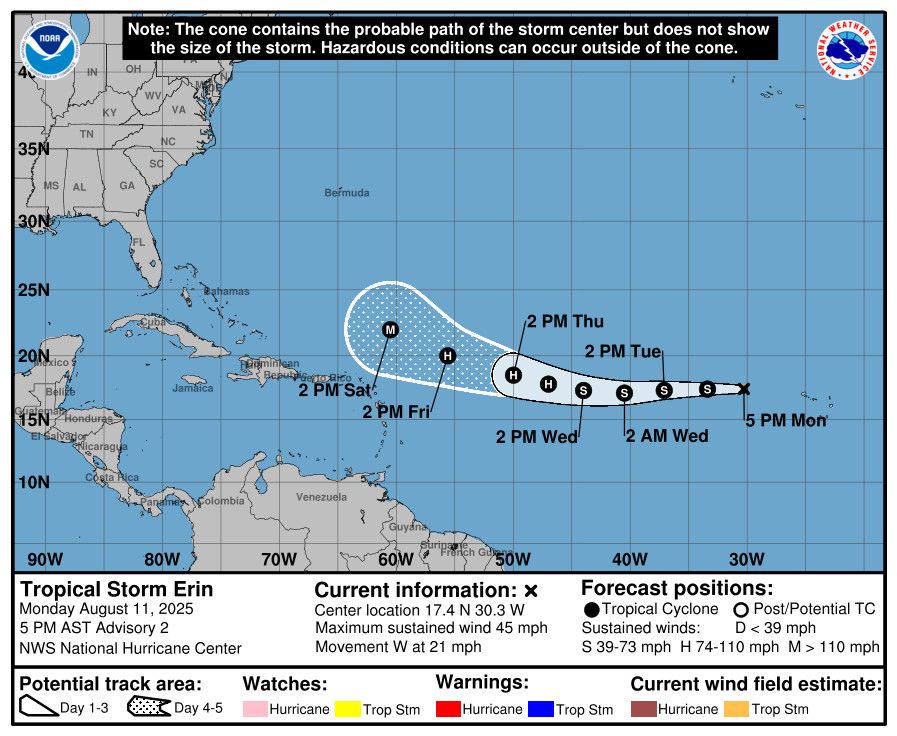
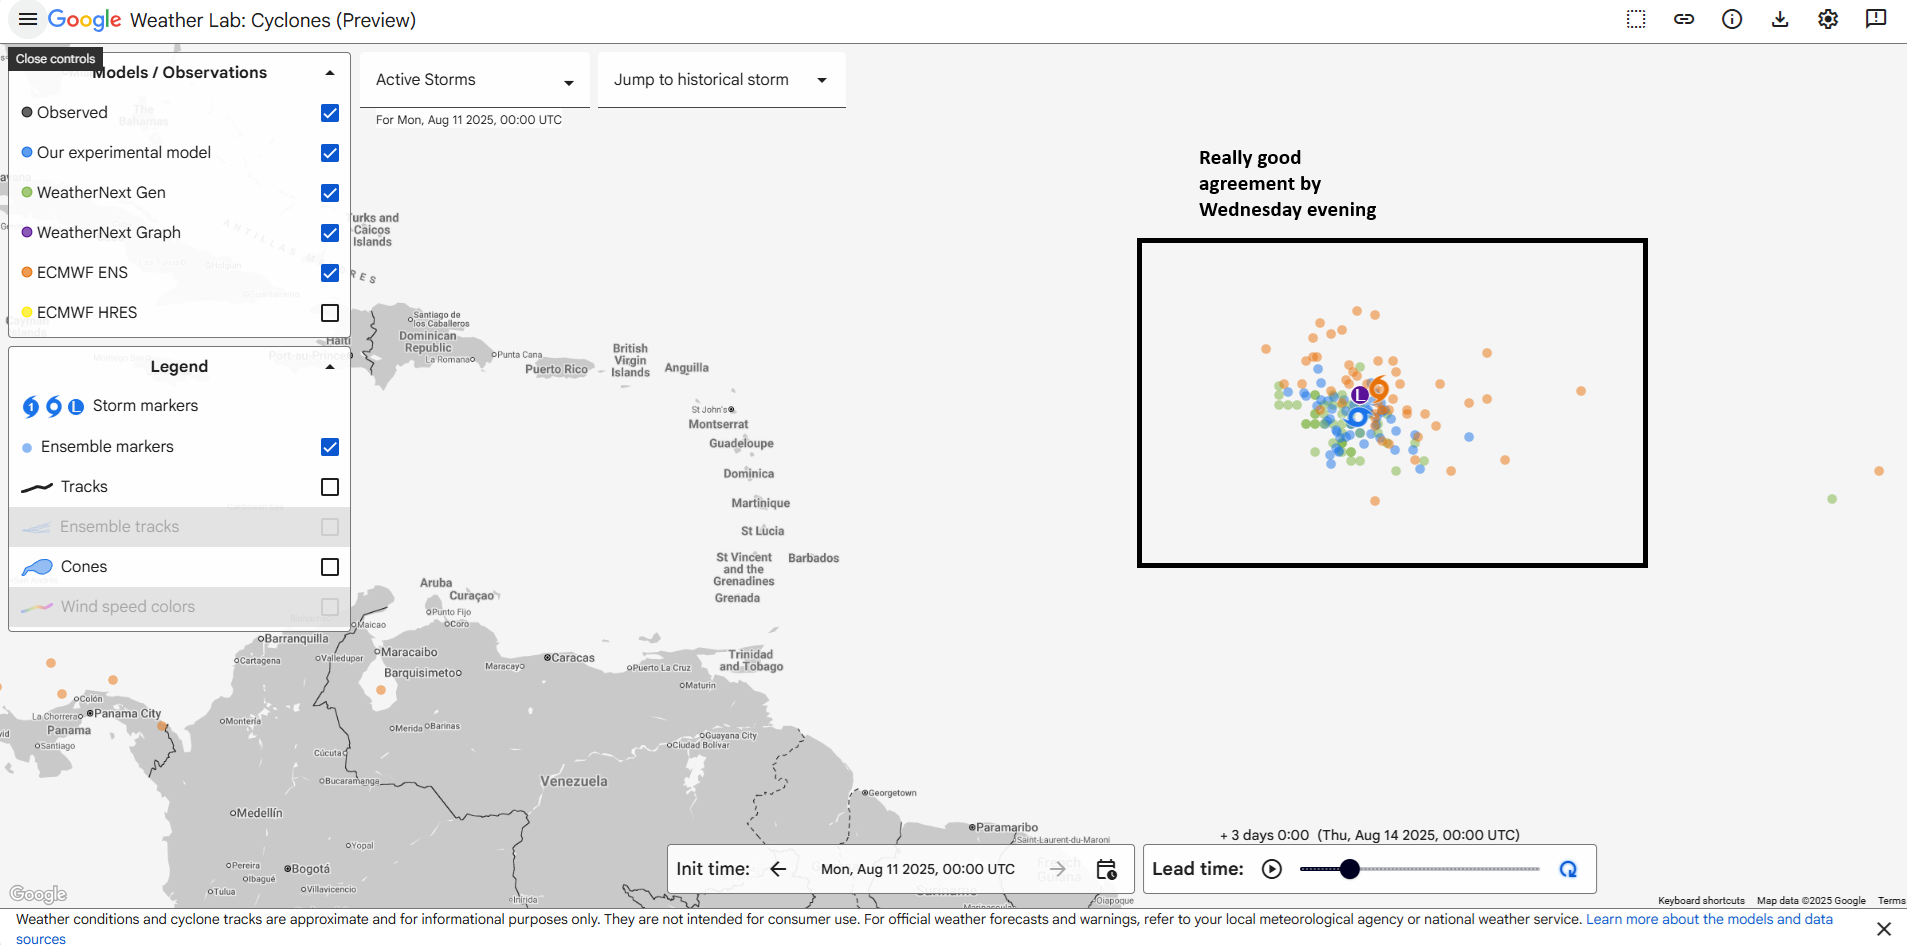
In terms of how close it gets to the islands, which is the first hurdle in terms of Erin’s track, there is strong agreement that it will pass comfortably north to avoid serious direct impacts. The Euro ensemble below shows this well.

What can we expect? Probably just a graze. As Erin passes north, it’s likely that some outer bands will graze Puerto Rico, the Virgin Islands, and the northeast Leeward Islands. Below is a forecast map for Saturday morning from the European operational model. Often, we tell you to ignore operational model guidance, but 2 to 3 days out, these deterministic models have value, particularly with established storms like Erin.
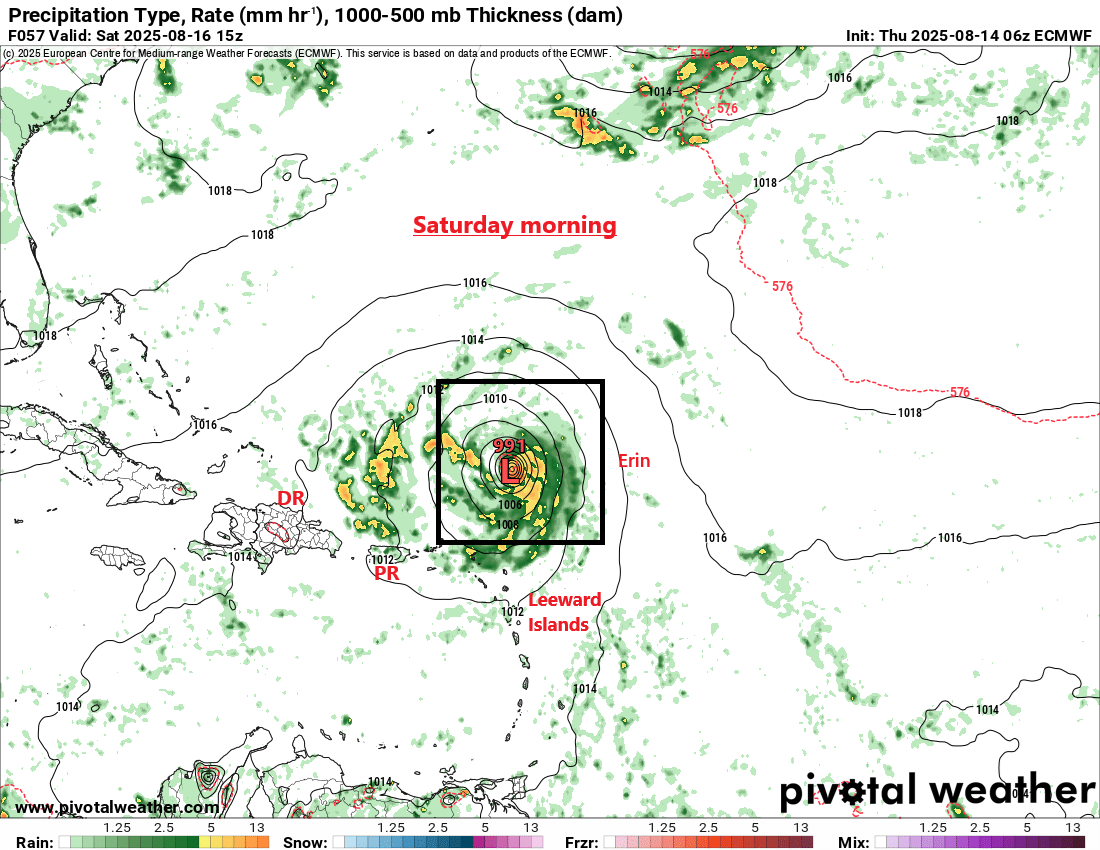
Mostly, however, the impacts will be marine-driven: Rough seas, high tides, rip currents.
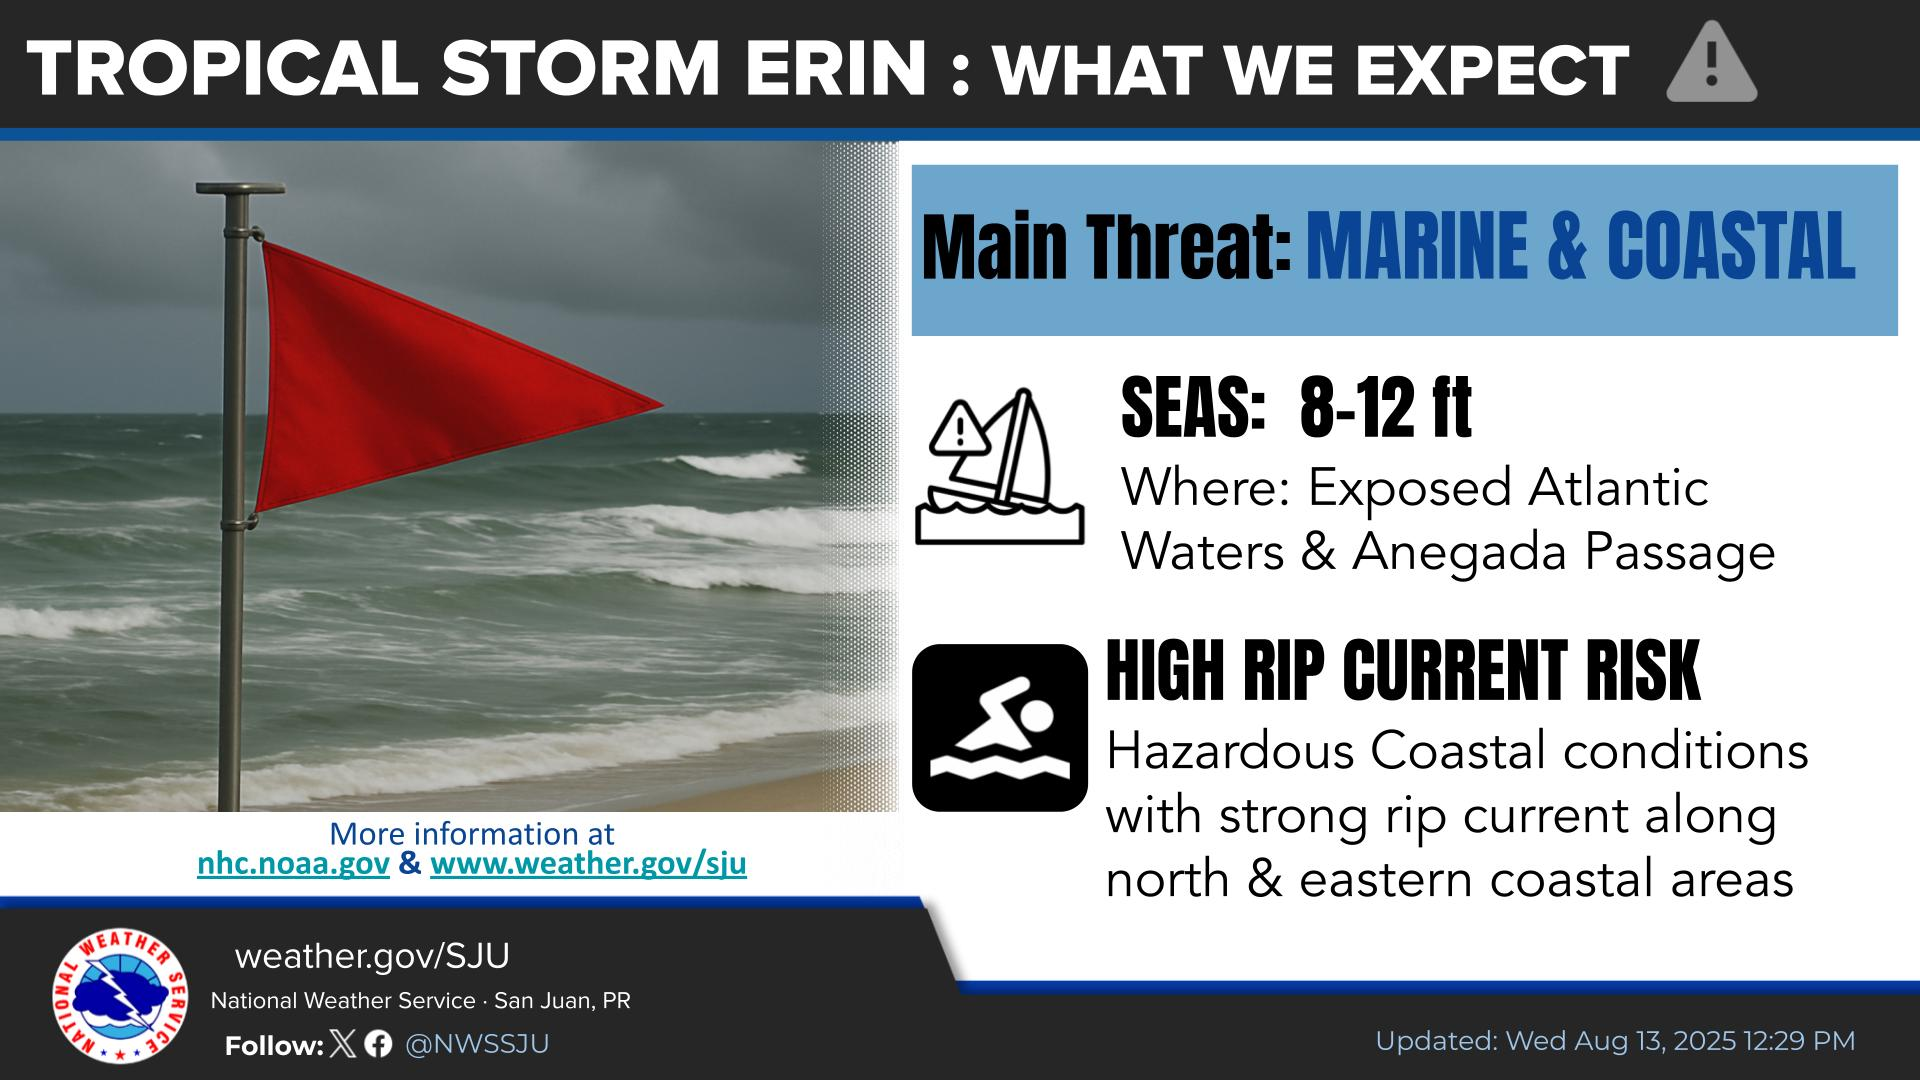
Certainly something to monitor and keep track of, particularly if you have any marine interests or will be visiting the area this weekend. But this is mostly from a safety and awareness standpoint. No direct or major impacts are expected.
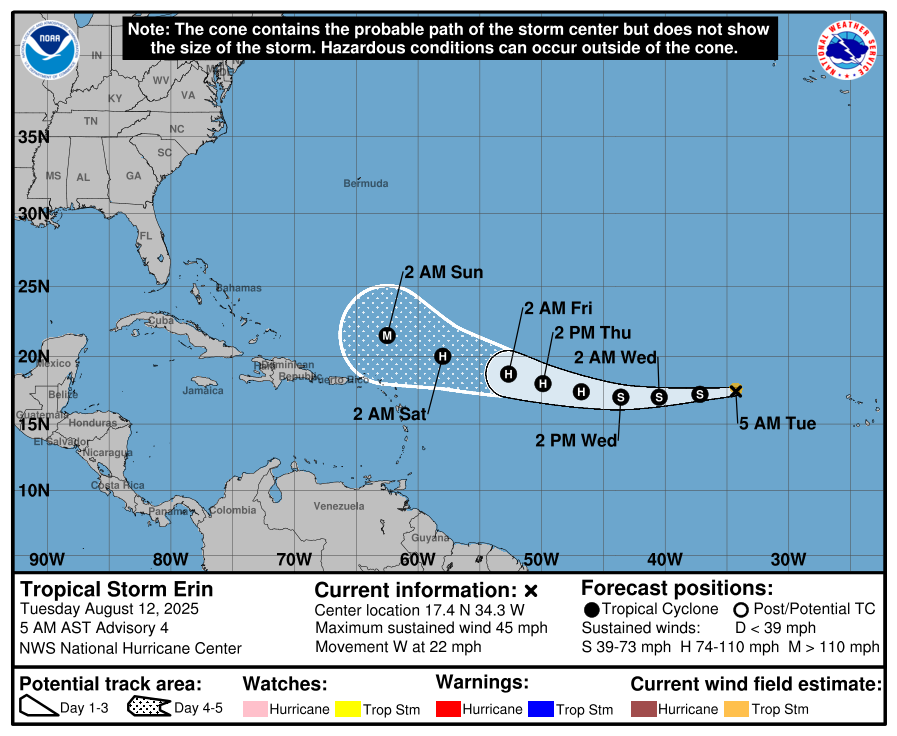
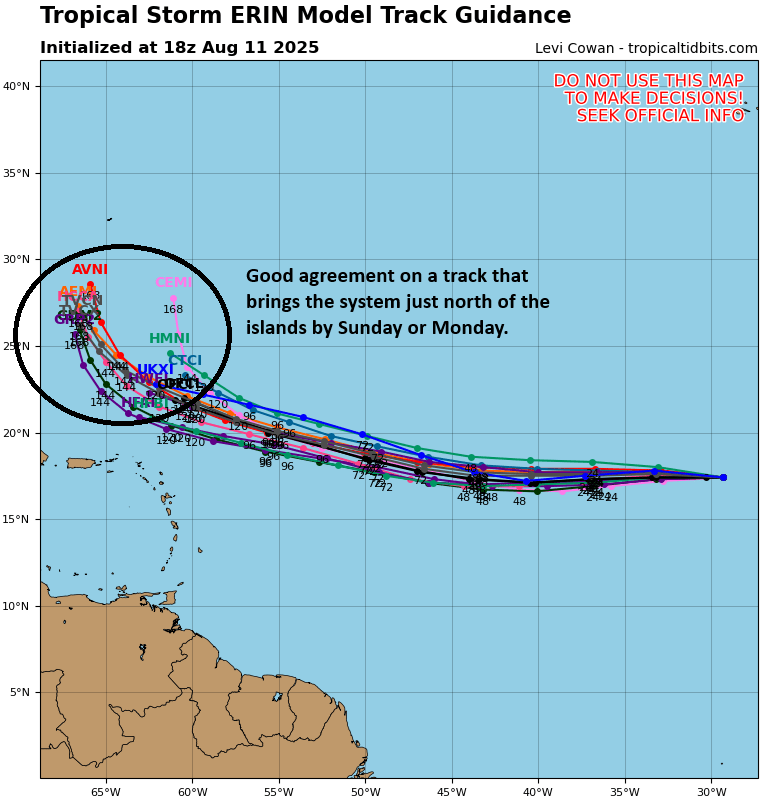
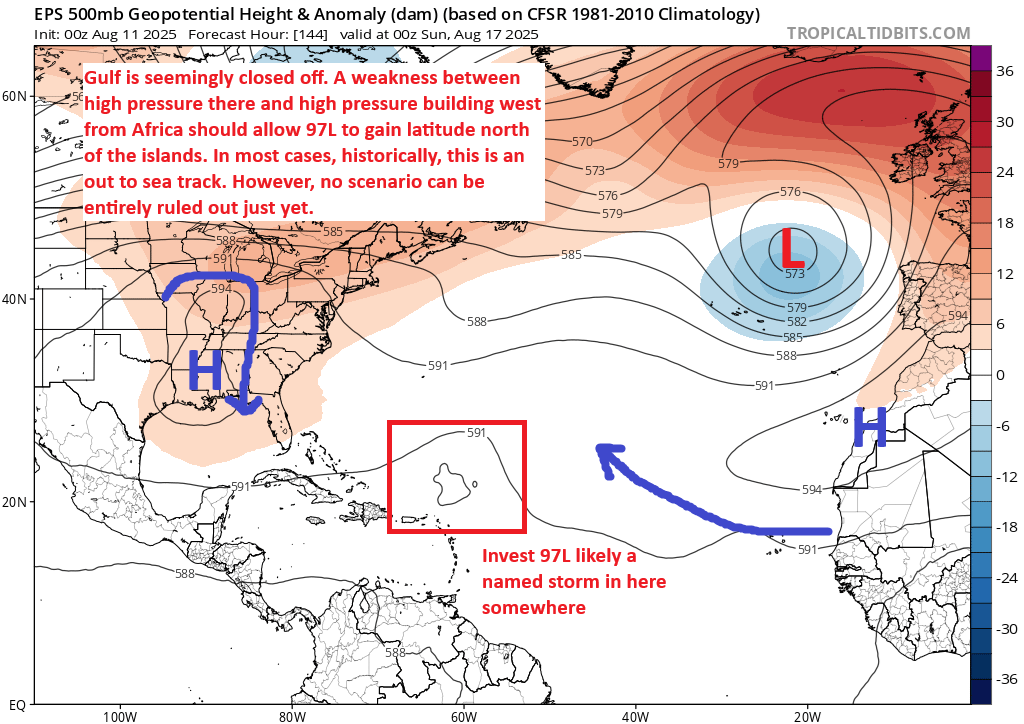
Beyond the Caribbean islands, what happens next? Well, there’s always some inherent uncertainty in tropical systems, but it’s not always equal. In other words, some 5 to 7 days forecasts have higher confidence than others. In this one, there is fairly high confidence that Erin is what we thought it was. Erin will turn northwest, then likely north and northeast rather quickly off the East Coast.
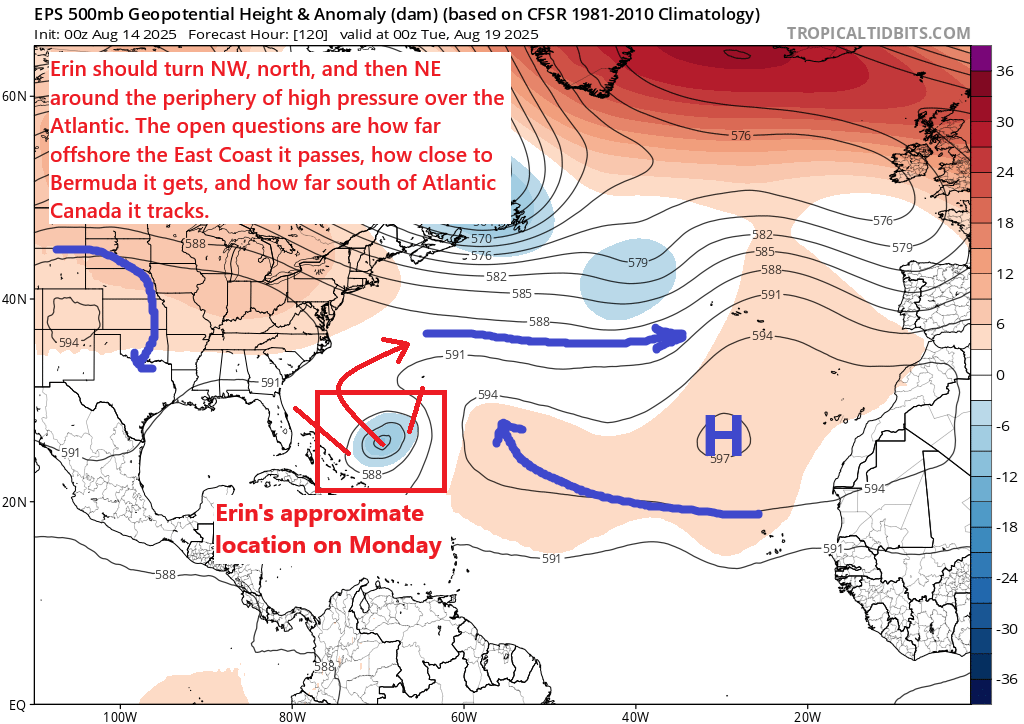
The questions I still have involve how close to the Bahamas and eventually Bermuda Erin gets. Additionally, how far offshore the storm will pass from the East Coast and Atlantic Canada. There has certainly been some “creep” to the west in the last couple days, which has undoubtedly made some folks on the East Coast a little uneasy. But at this point, all we can say is to keep an eye on things. We do not expect a track, plowing Erin into the Carolinas or New England. But it could always pass close enough for some impacts. We’ll keep you posted. Bermuda needs to watch Erin very closely. Hopefully we see some clarity on that in the next couple days.
One thing we can say for sure? Rough surf and rip currents will begin to increase by later this weekend or early next week on the East Coast. Please use caution in the water, particularly if you’re taking a late summer vacation next week.
We’ll keep you posted through the weekend.
Invest 98L
Meanwhile, in the Bay of Campeche, the tropical wave that we started watching a little more closely on Tuesday evening has now been designated Invest 98L. It actually looks okay this morning, though it lacks any sort of defined circulation center. So at this point, it’s just a coherent area of thunderstorms.
Invest 98L is going to track almost straight northwest over the next 24 to 30 hours. This should come ashore in Texas by Friday evening. Any development will be lower-end and rather disjointed. In other words, we could see a sloppy tropical depression come out of this, but we probably won’t see a named storm.
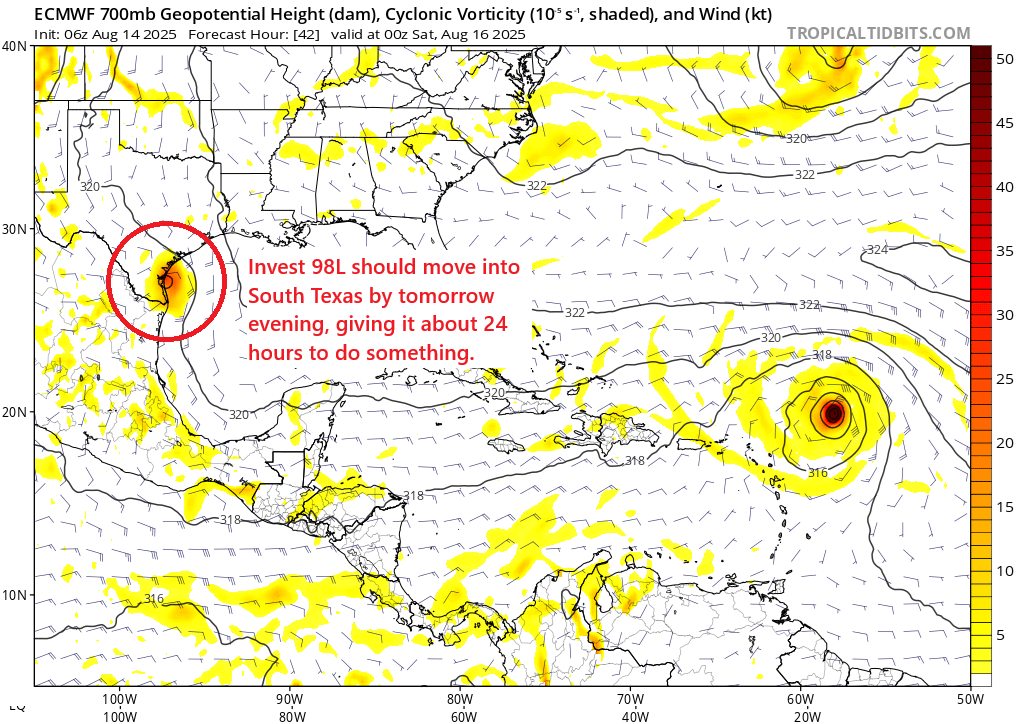
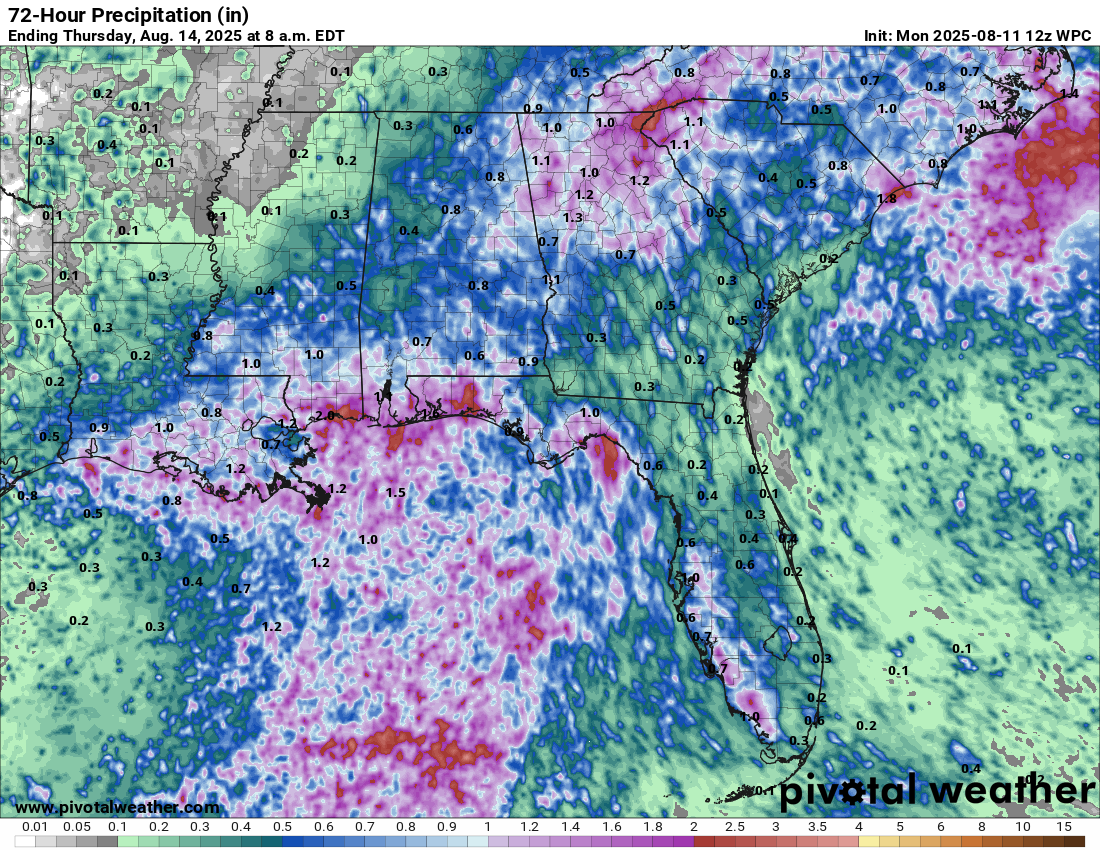
That said, given the thunderstorm organization here, we could see some locally heavy rainfall in South Texas as this comes in. I think as we saw last month, it does not take a well organized tropical system to cause problems in Texas. As this moves from the coastal bend into interior Texas, we will keep an eye on flooding risks that may emerge from this, although right now those risks are on the low to very low side.
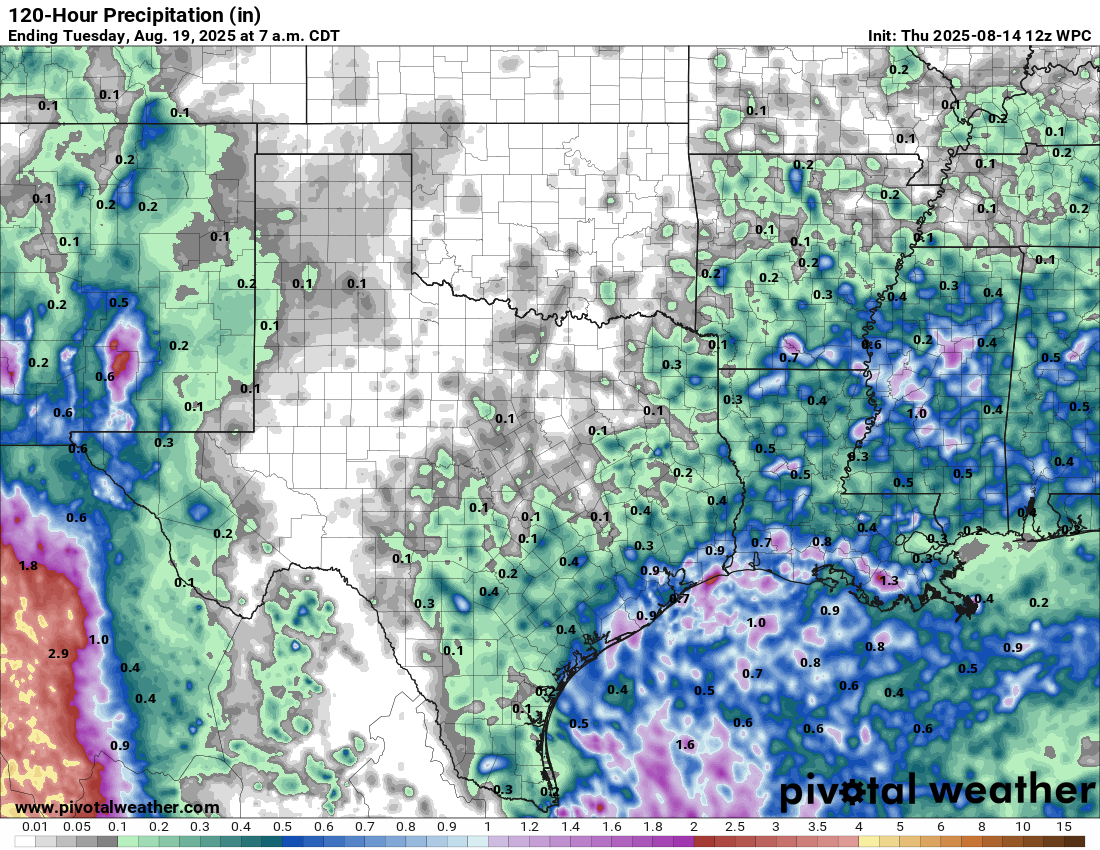
Overall, the thinking is that this will be more beneficial with increased rain chances over drier South Texas than anything else.
Elsewhere, no other specific waves are of serious concern right now, but we’ll keep an eye on that over the next few days and see if new areas of interest are introduced. We’ll stop there for now. Keep tabs on our Notes for any intermittent updates.