In brief: A major series of atmospheric river-driven storms will impact the West heading into next week, this time focusing more on California. The storm system that hits Tuesday night and Wednesday may be particularly significant there. Elsewhere, windy weather will have a hold on the Front Range & Foothills today in Colorado with dangerous fire weather possible. Warm weather is in control for most places for a good bit of the rest of 2025.
Western Weather is wild!
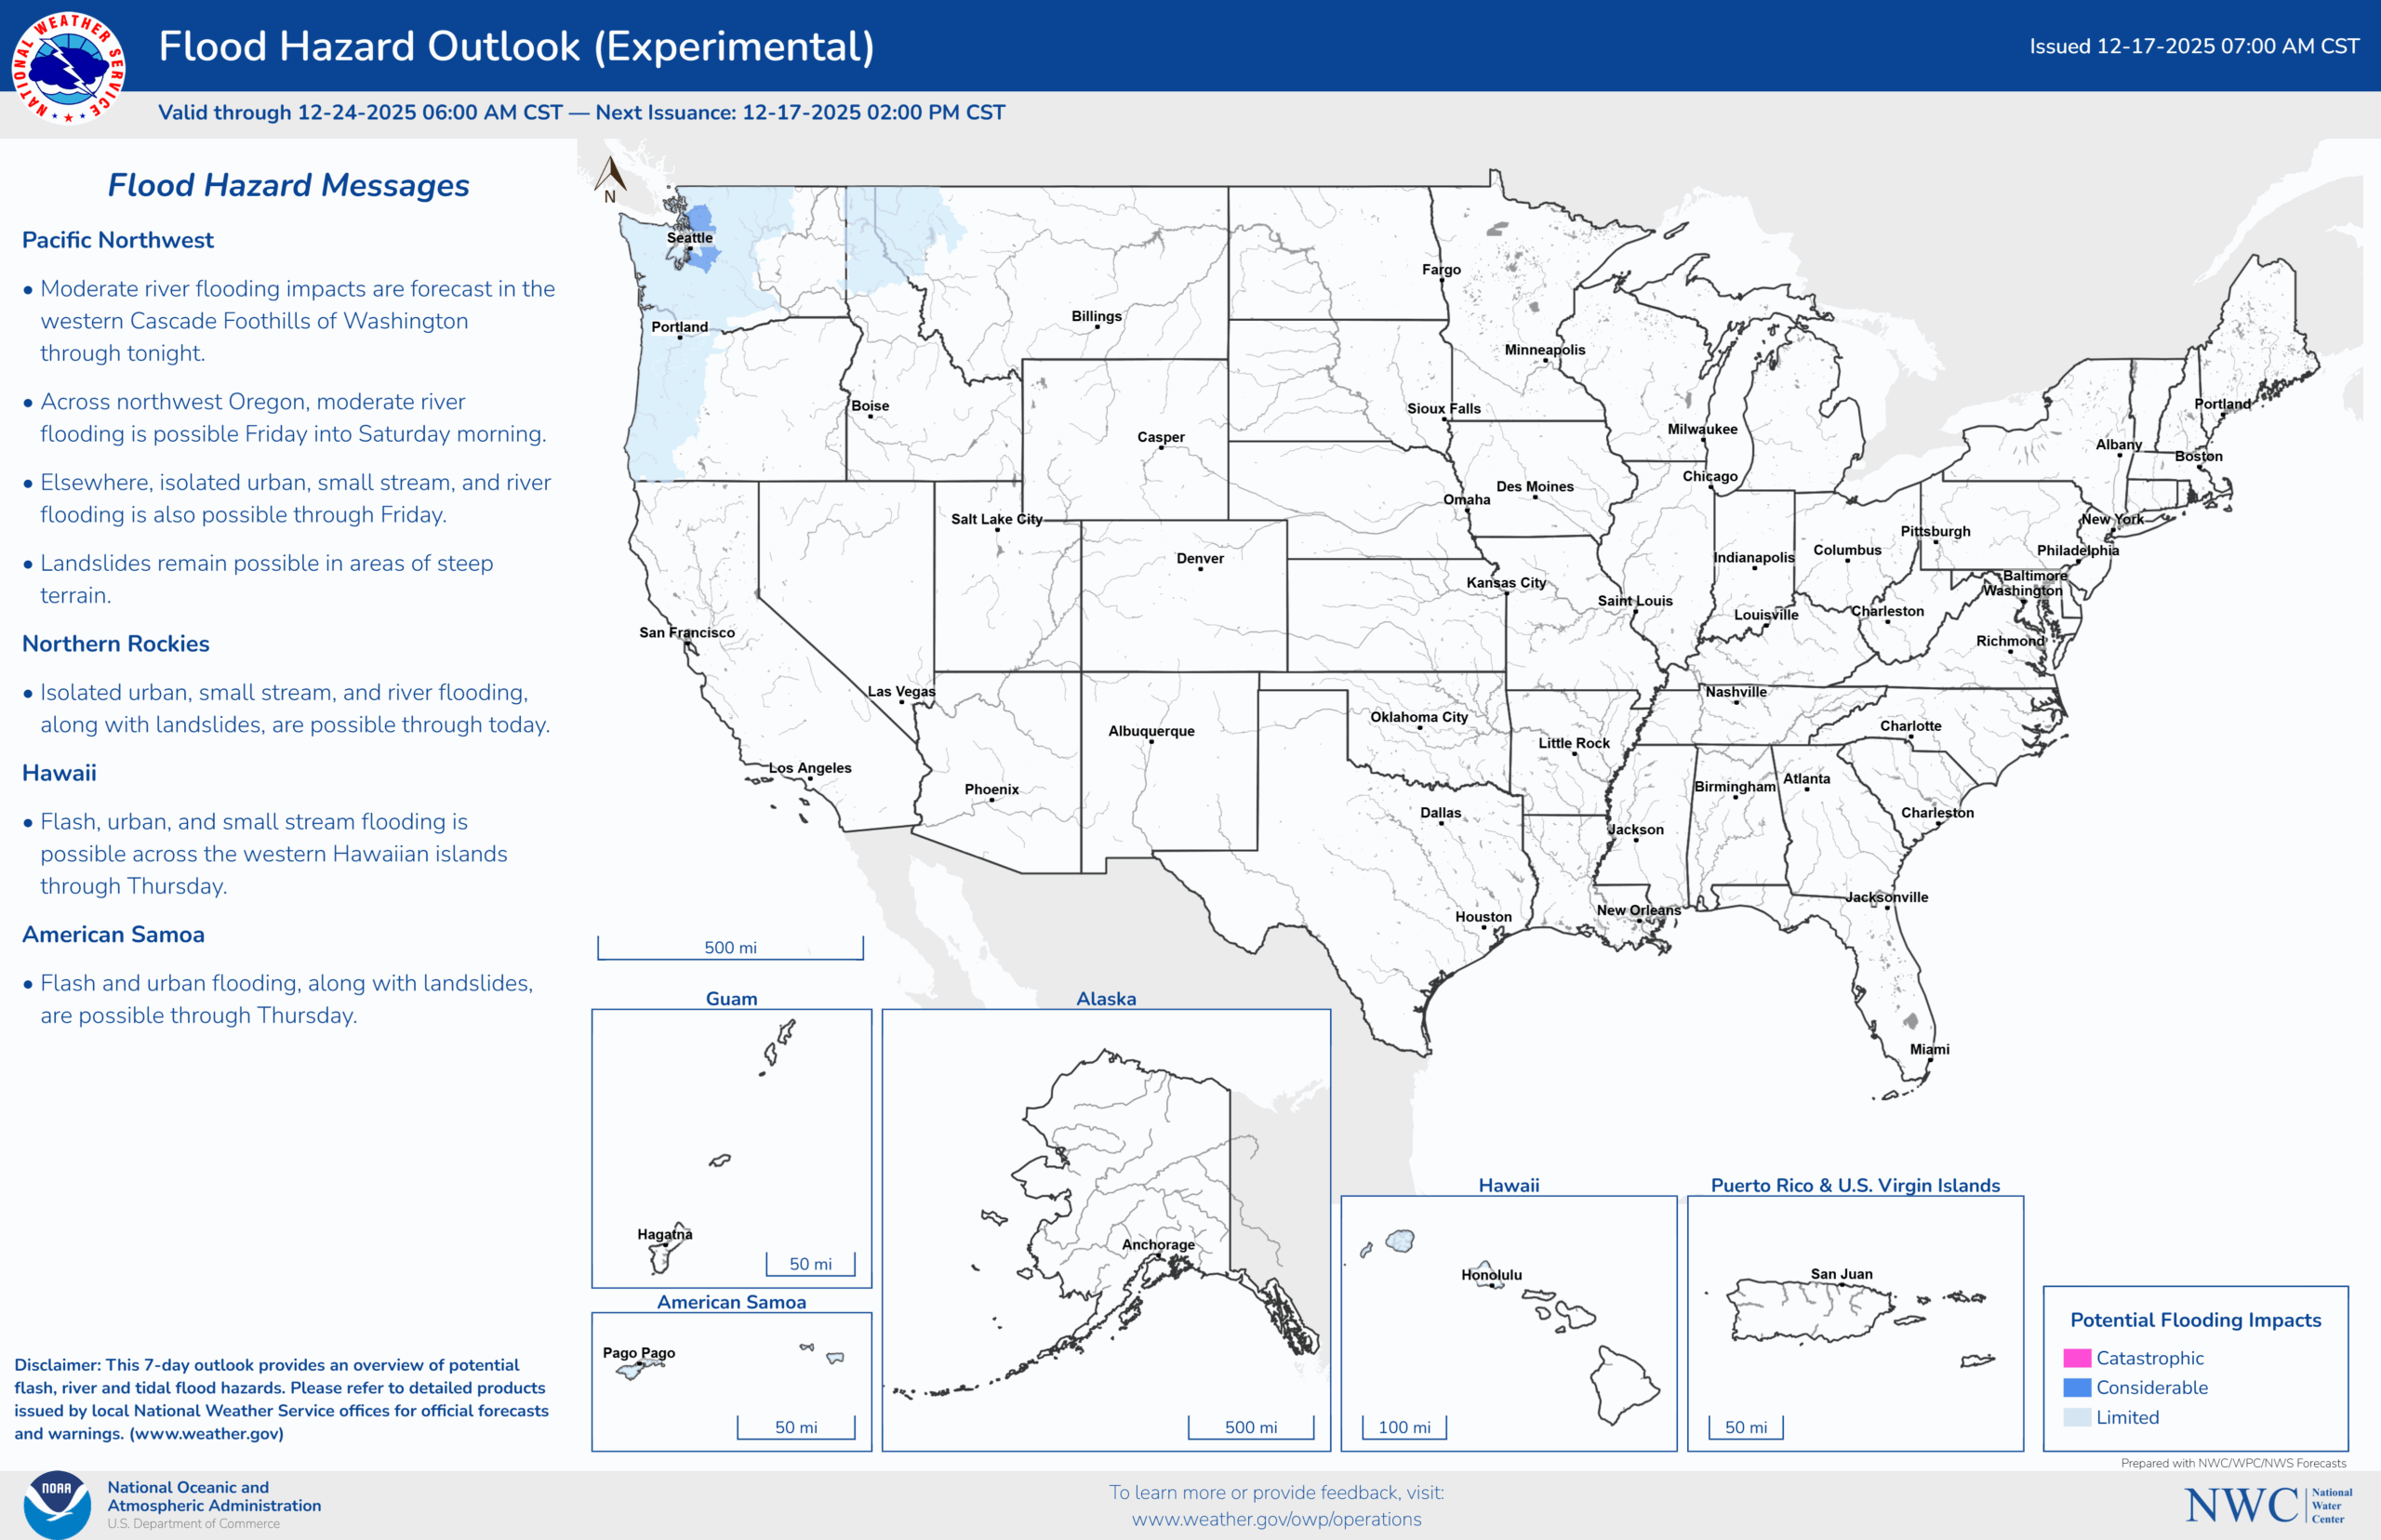
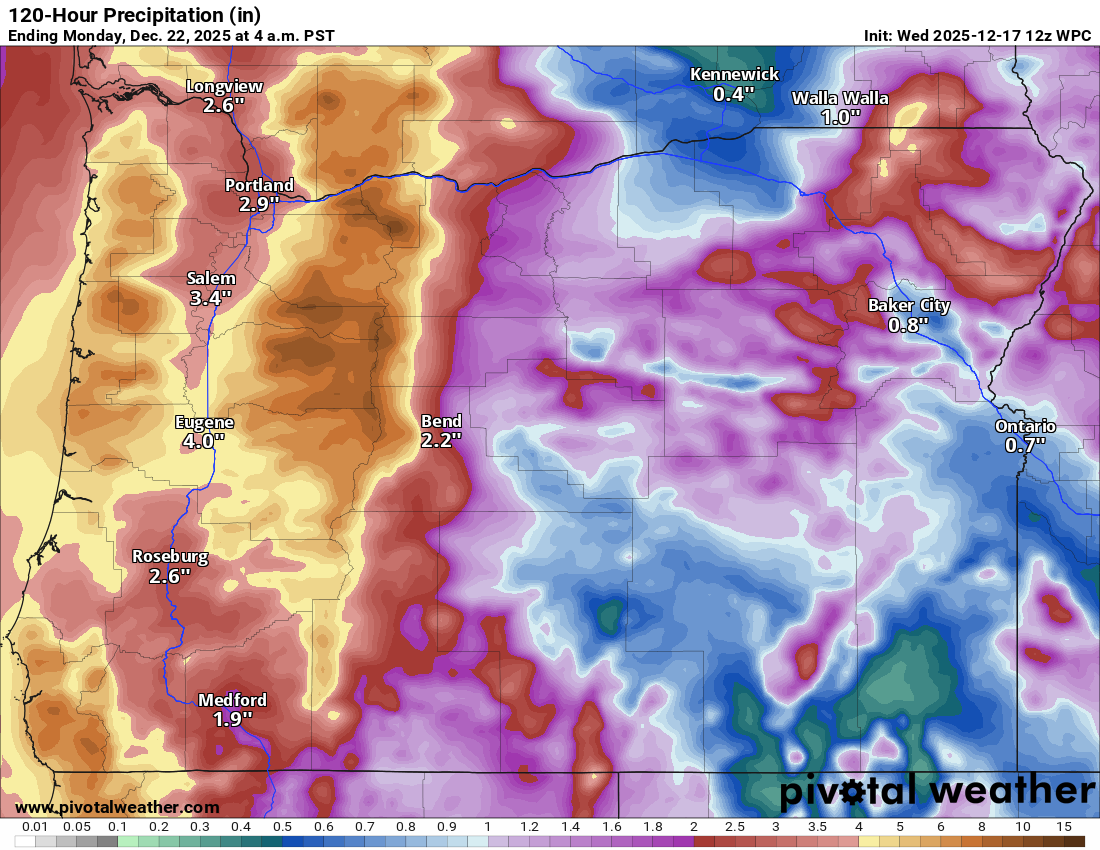
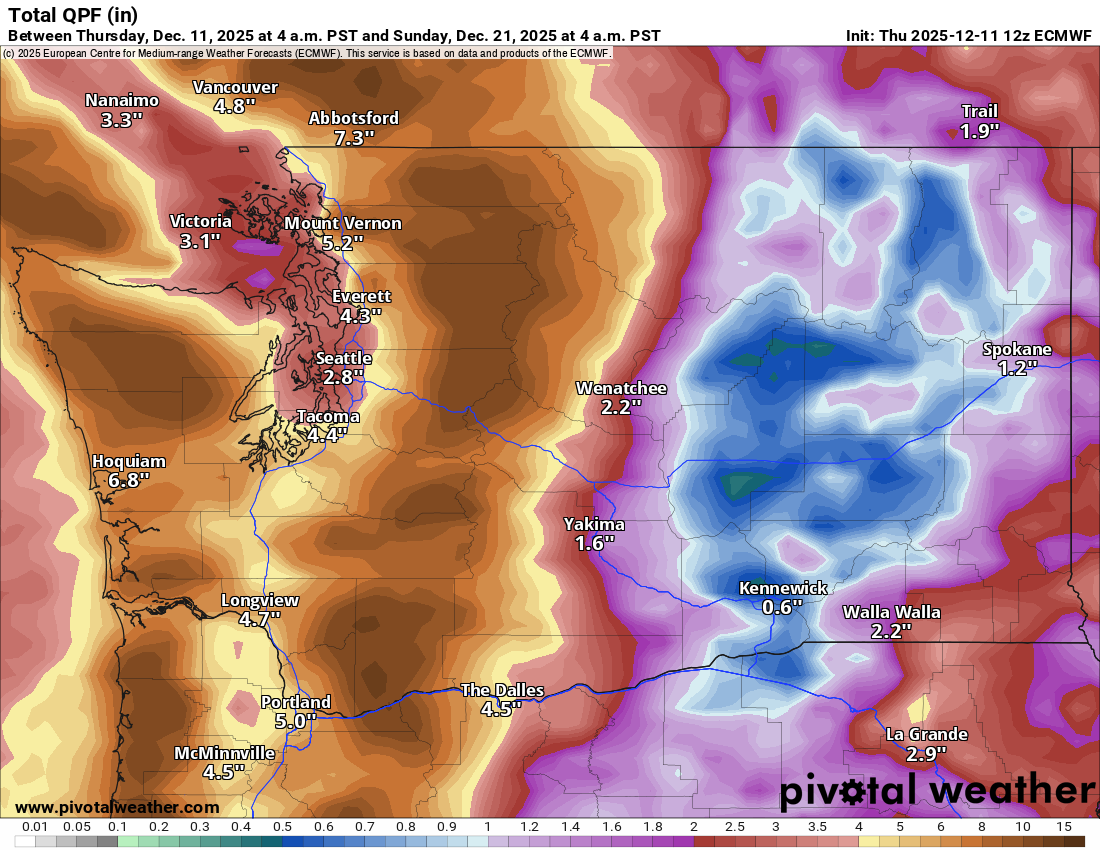
The last couple posts have been heavily policy-related matters (though I do want to point you to a later night update yesterday from Alan Gerard’s Balanced Weather), so let’s focus mostly on actual weather today, because the West is in for it. The firehose is turned on and will not turn off anytime soon. However, it will take aim at differing parts of the West Coast at different times. The heaviest precipitation will exit Oregon today and push into Northern California while weakening. This leads to a generally calmer day Saturday across the West. On Saturday night and Sunday, the moisture plume revs back up, aiming primarily at parts of southern Oregon and northern California, north of the Bay Area.
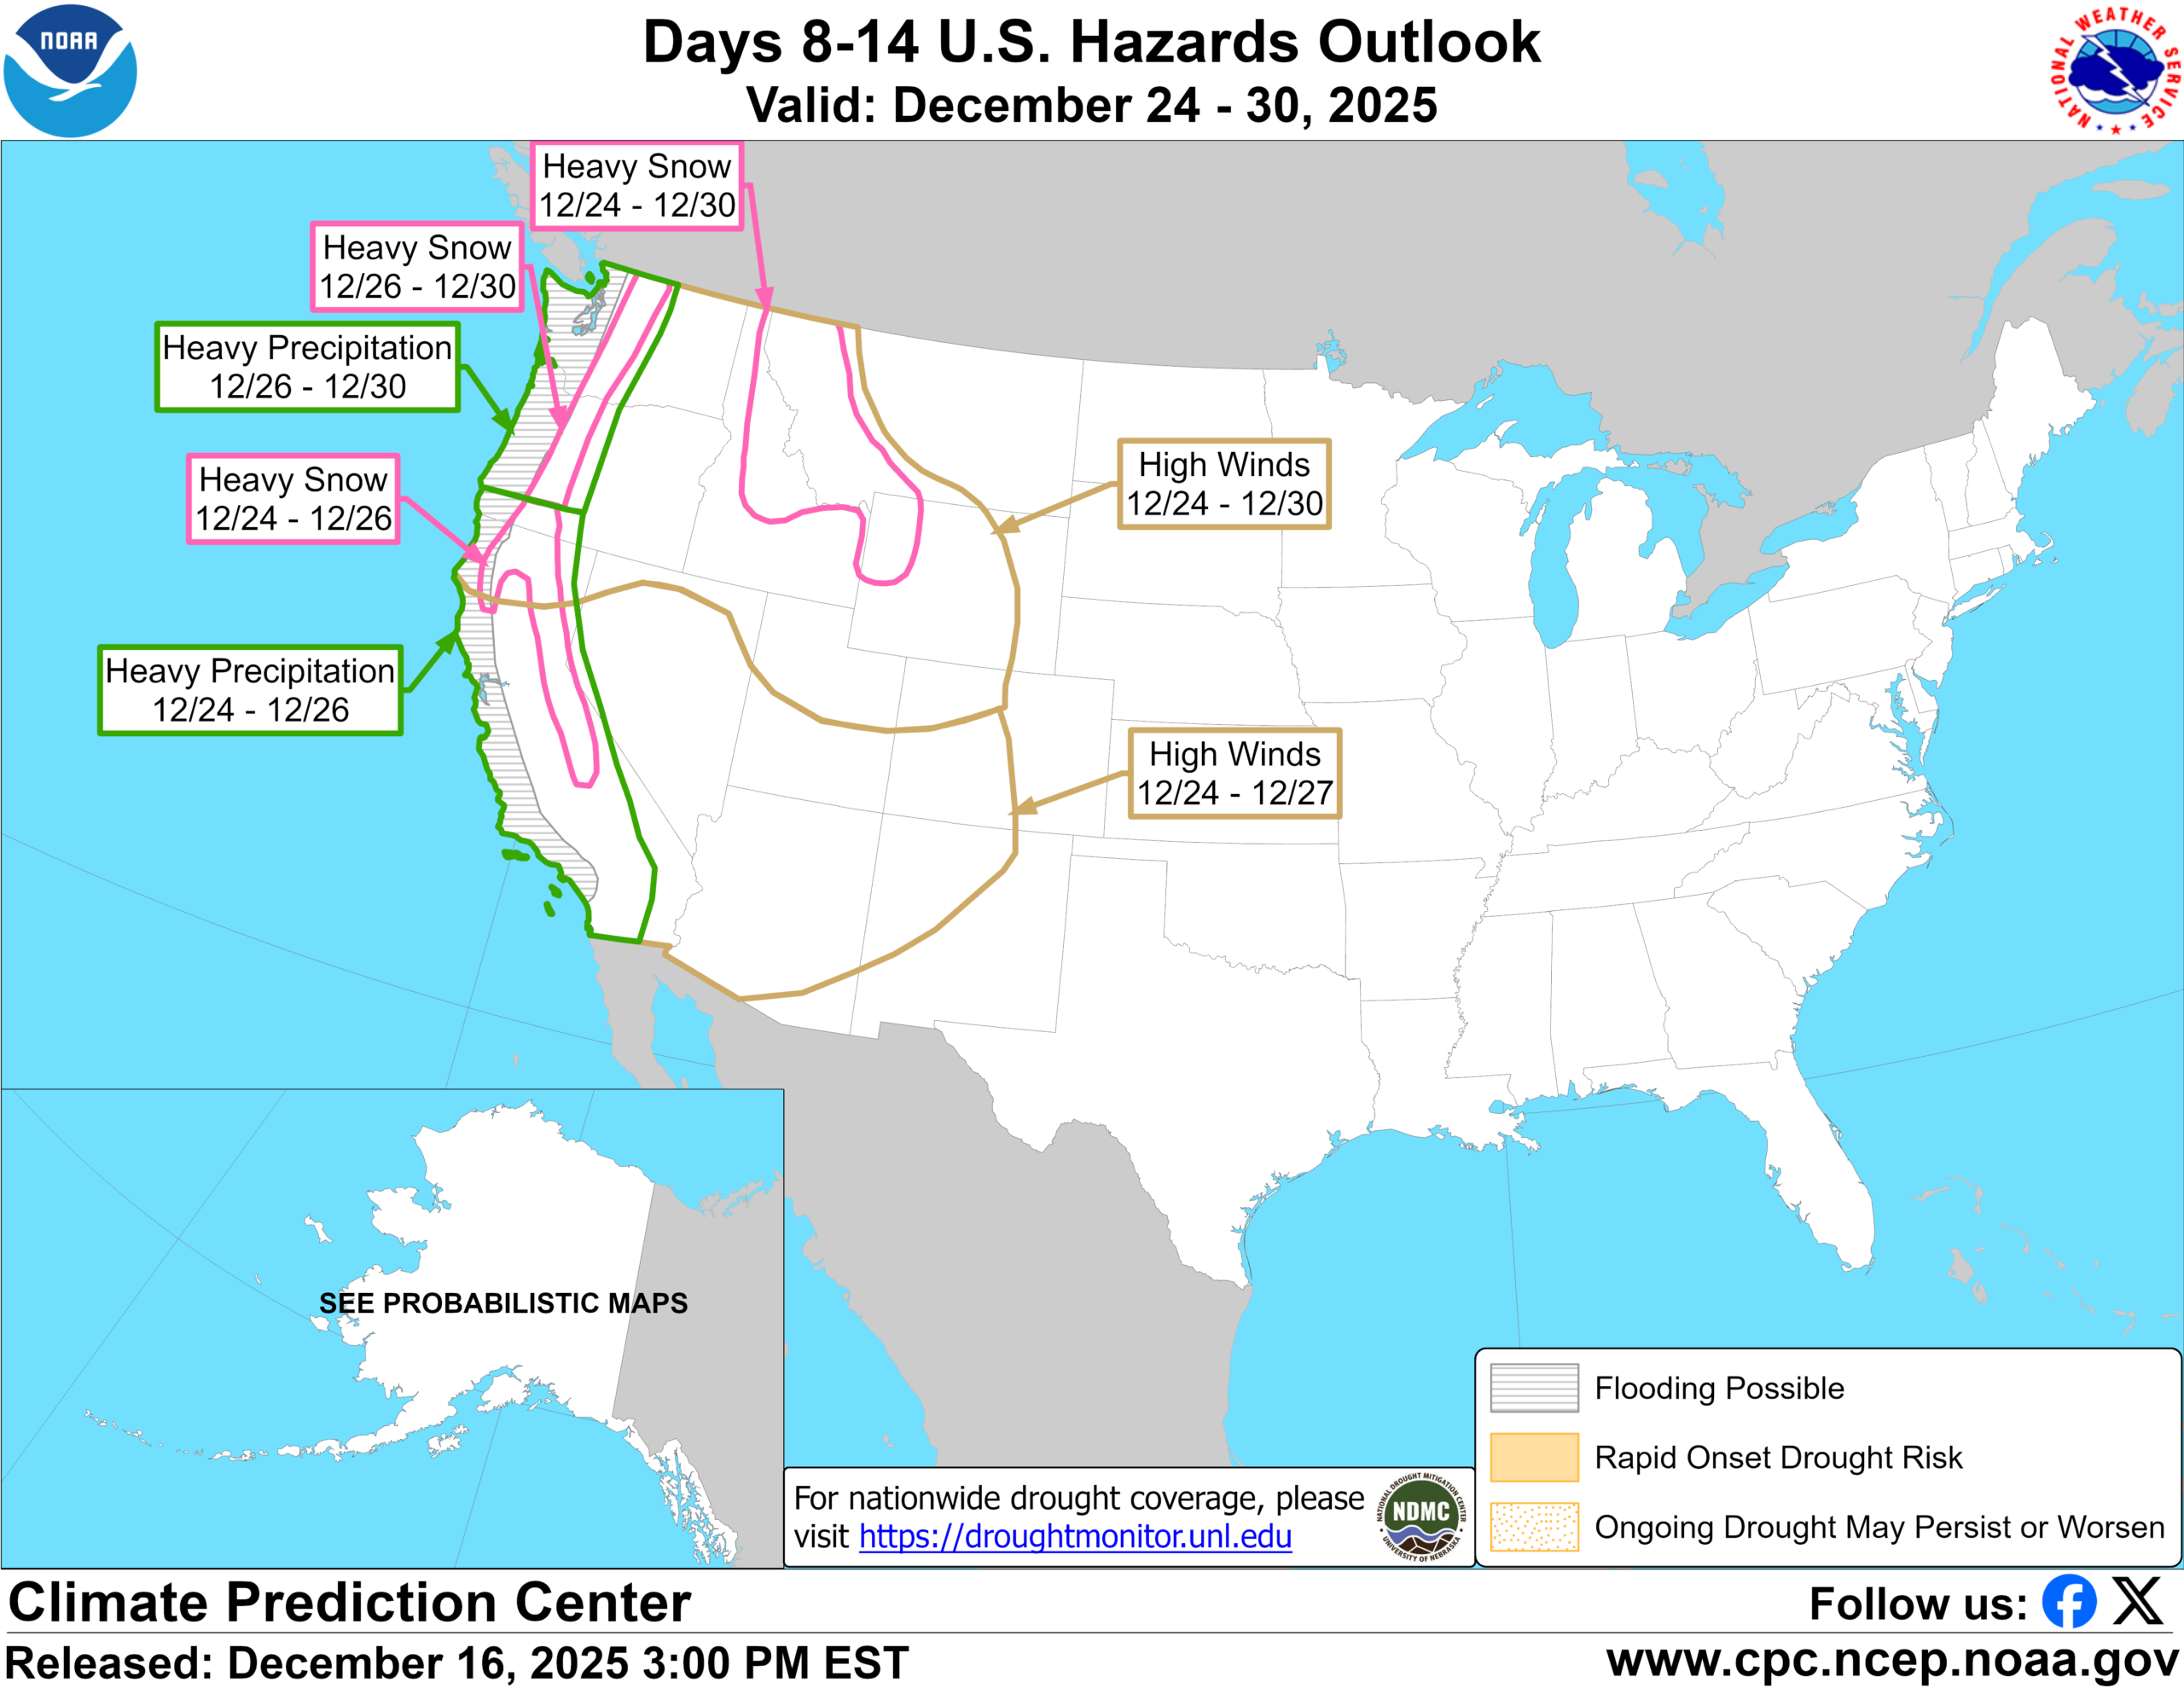
That continues Monday, with perhaps a slight downtrend in precip intensity. By later Tuesday and into Christmas Eve, it appears that a significant storm is going to deliver a multitude of hazards to California, including flooding rains, mudslide risk, debris flow risk, strong winds, and extremely heavy snow in the Sierra. This comes in two or three “waves” of action continuing into Christmas Day. Each one gets slightly colder, so snow levels will slowly drop through the event as well. Things reset next Friday and Saturday with a focus on British Columbia, before perhaps the next plume aims at the Northwest again on the following Sunday or Monday before New Year’s.
The key point: The most significant impact of this multi-day atmospheric river event will probably occur Tuesday night through Thursday, focused primarily on California.
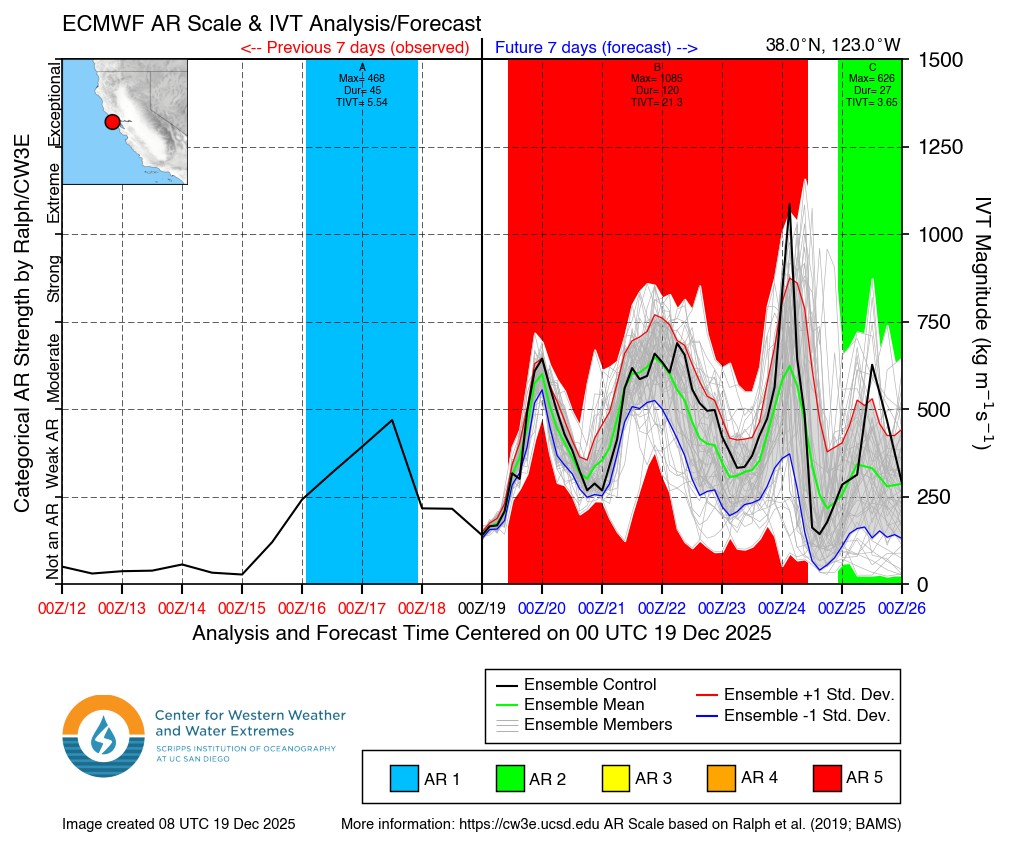
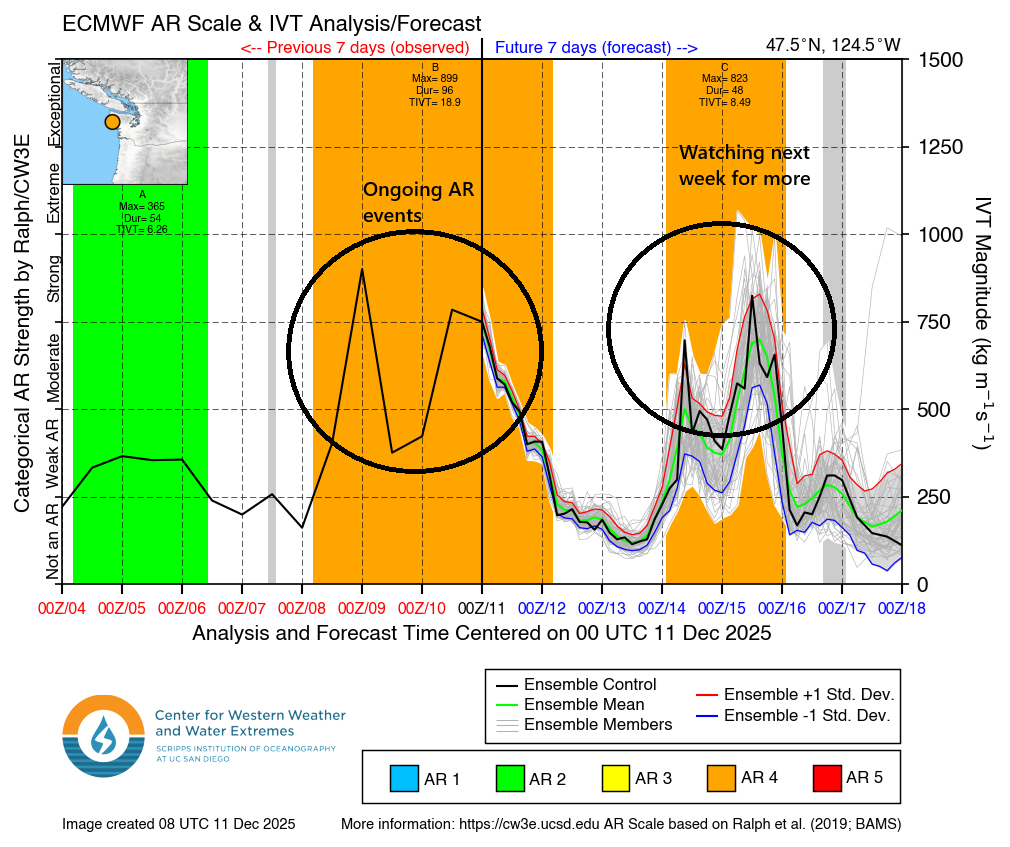
You can see from the chart above that estimates atmospheric river “intensity” for the Bay Area that the intensity picks up today, Sunday, and Tuesday night into Wednesday, with the strongest of the event occurring then (pushing into category 5 level intensity). Let’s talk about total precipitation expected in California. Snow-wise, it looks like a solid 3-to-6-foot type snow event for the High Sierra, with the potential for higher or lower amounts depending on the exact setup that unfolds, but let’s go with that estimate right now as a placeholder based on the most recent data. Liquid-wise? We’re looking at perhaps as much as 15 to 20 inches of liquid equivalent in the northernmost Sierra and just south of the Shasta area.
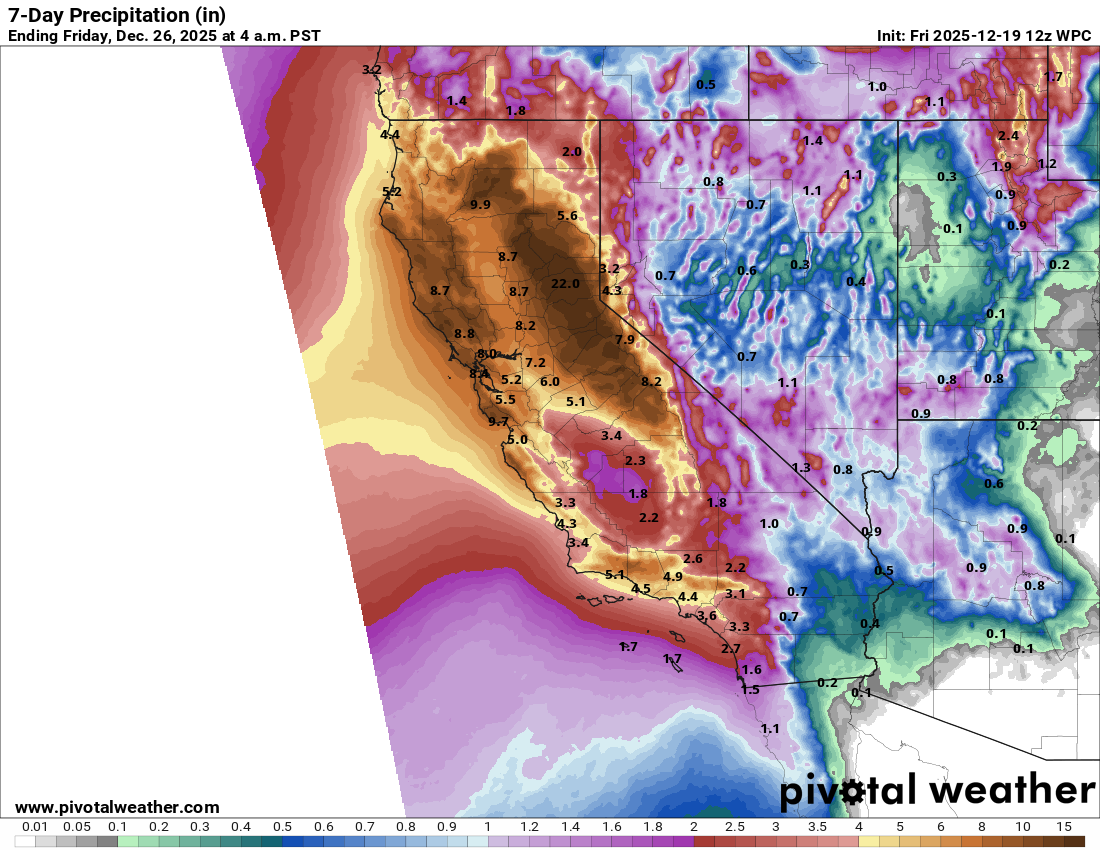
Expect a flurry of watches, warnings, and advisories to be issued in the next couple days, and expect travel across California to be impacted by this series of storms, especially Sunday into Wednesday.
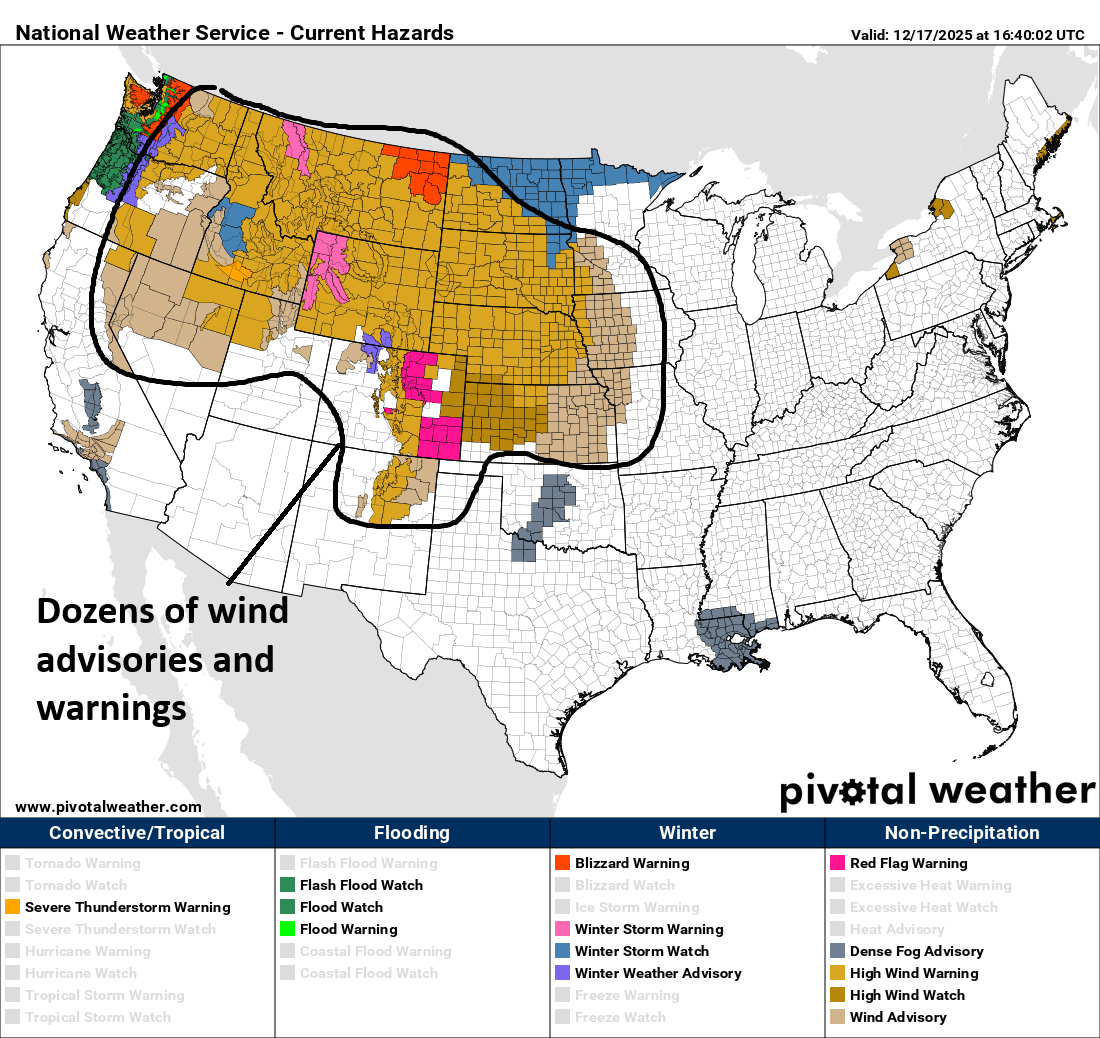
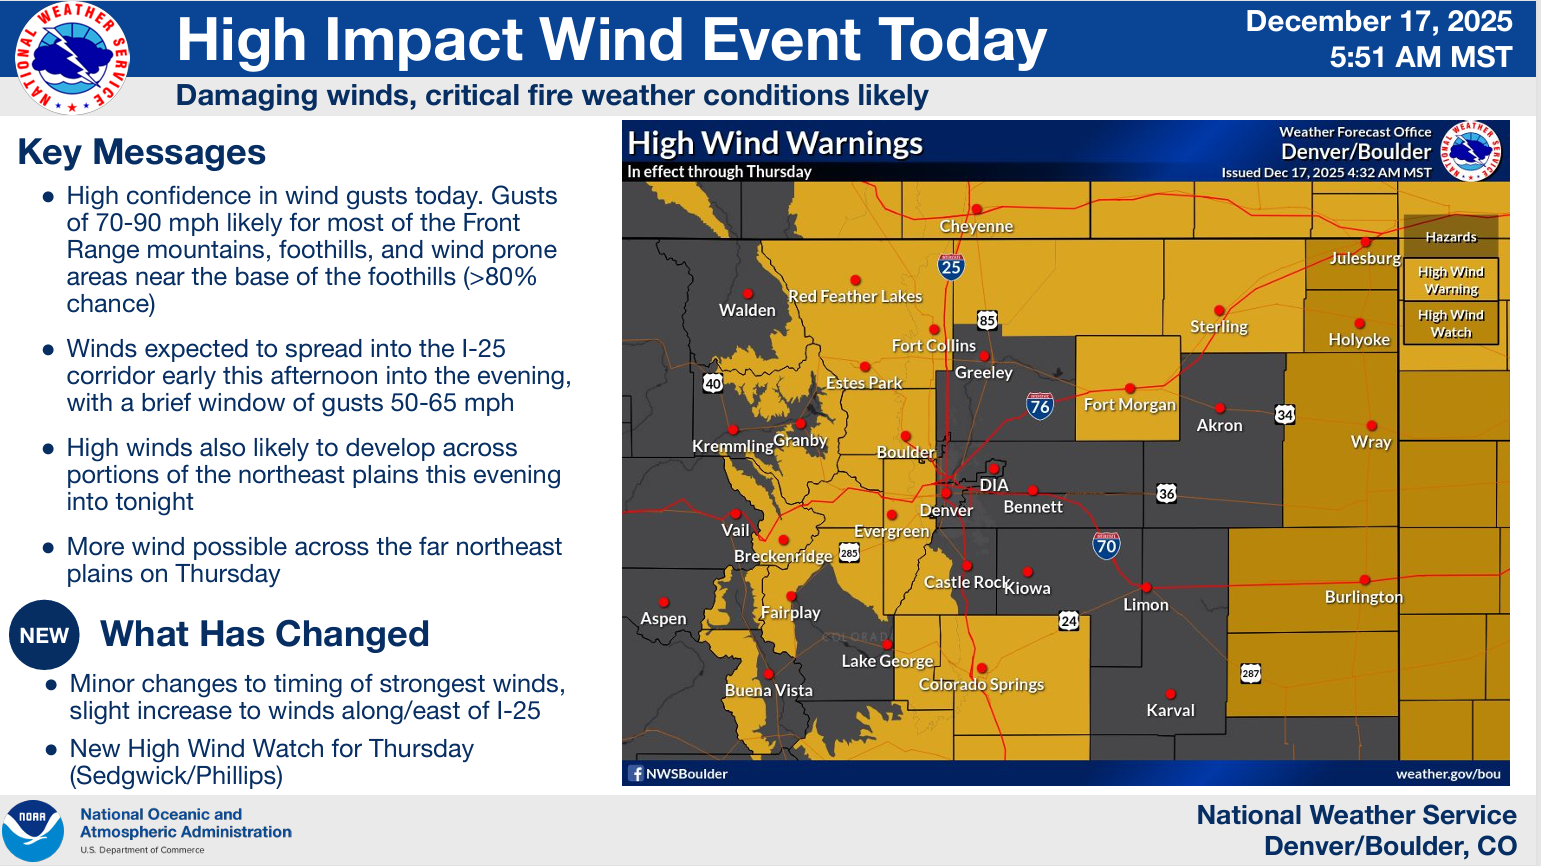
Front Range & Foothills windstorm
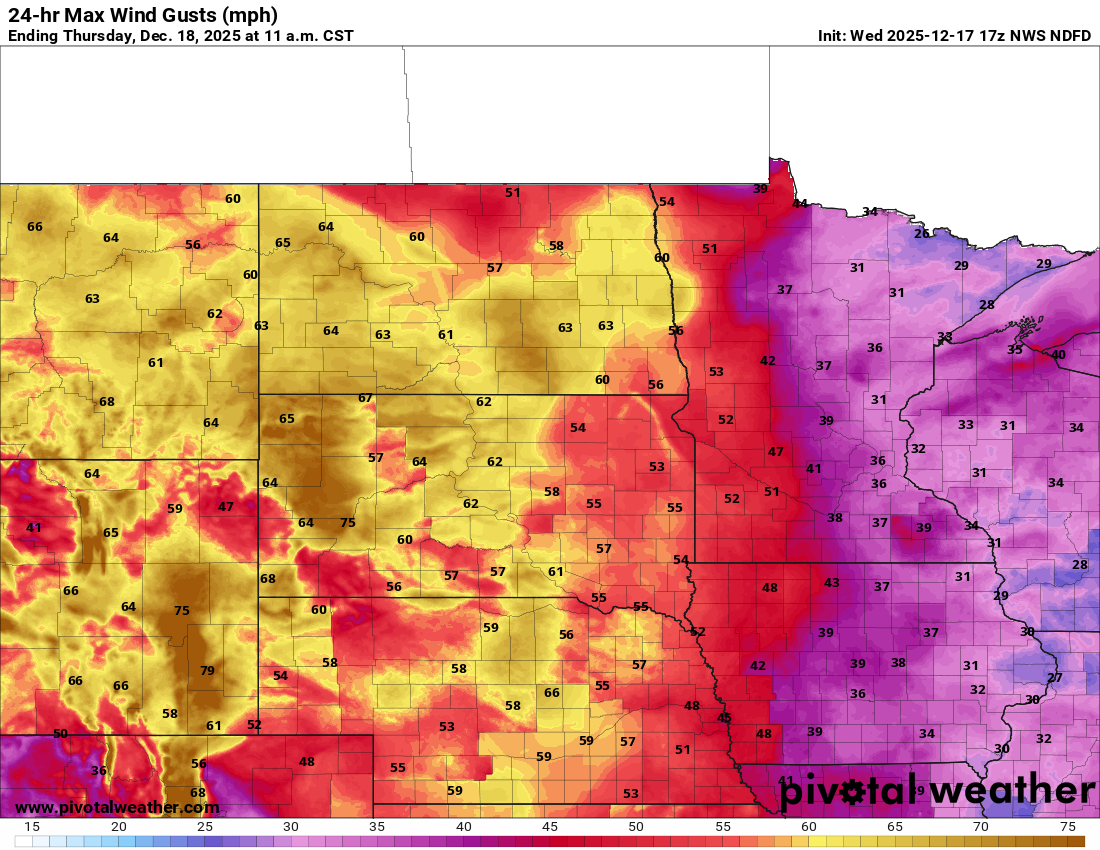
Another round of particularly powerful winds will occur today across the West, with a focus on Colorado again for perhaps the most significant impacts. A combination of low humidity and wind gusts in excess of 70 to 80 mph will be possible primarily west of the immediate Denver and Colorado Springs metros. Red flag warnings are posted in these areas with extremely high fire risk.
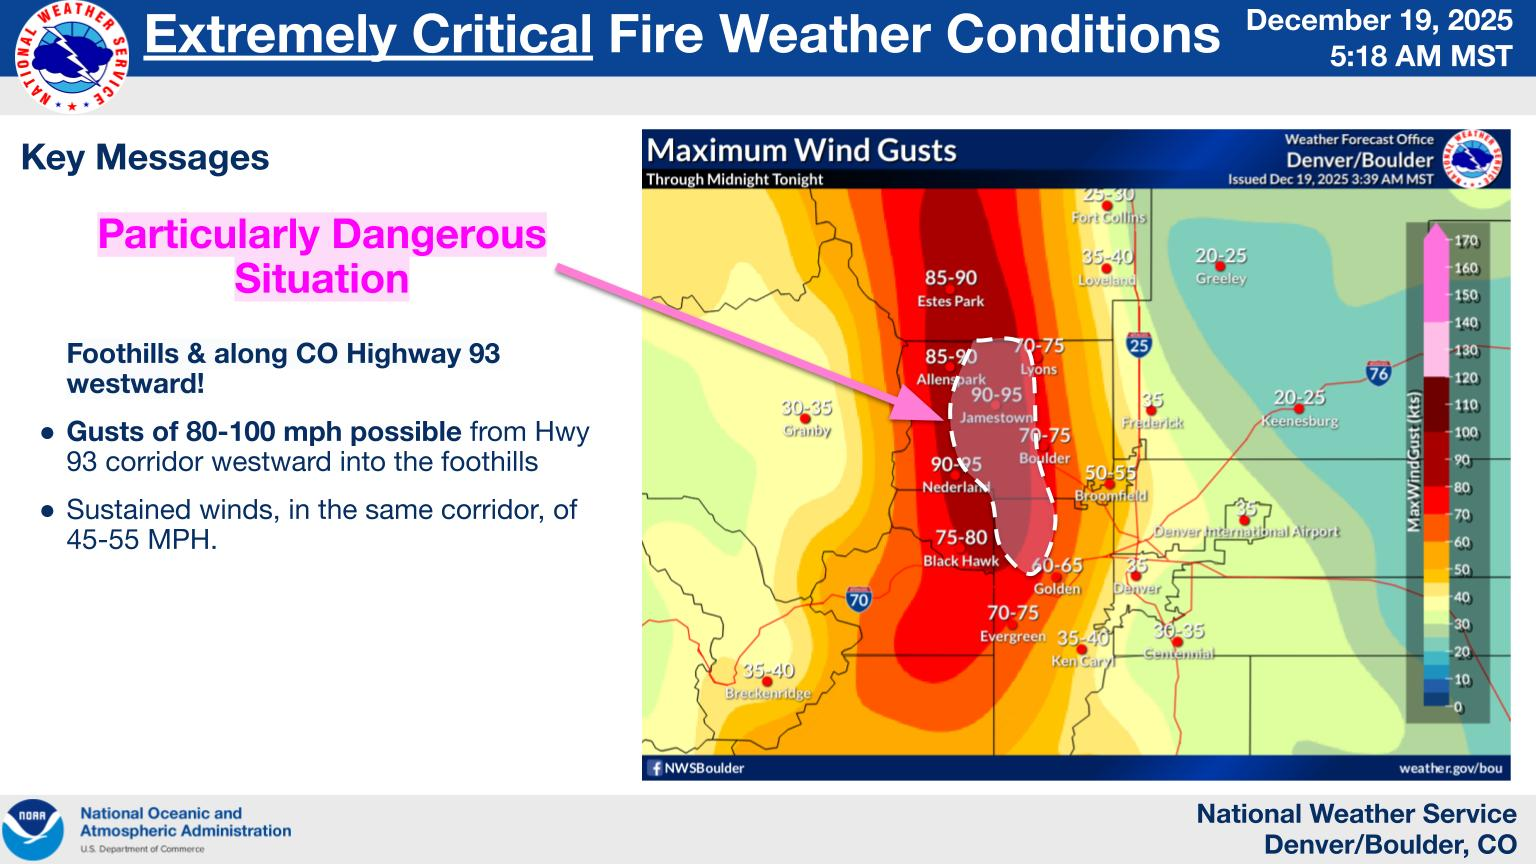
Additional wind events seem likely on Sunday and Wednesday as well, though hopefully slightly less intense than today. Precipitation looks to be at a premium in the Front Range and Urban Corridor, with perhaps some good snows possible in northwest Colorado this weekend and later next week, especially for Steamboat and Winter Park.
Warmth continues
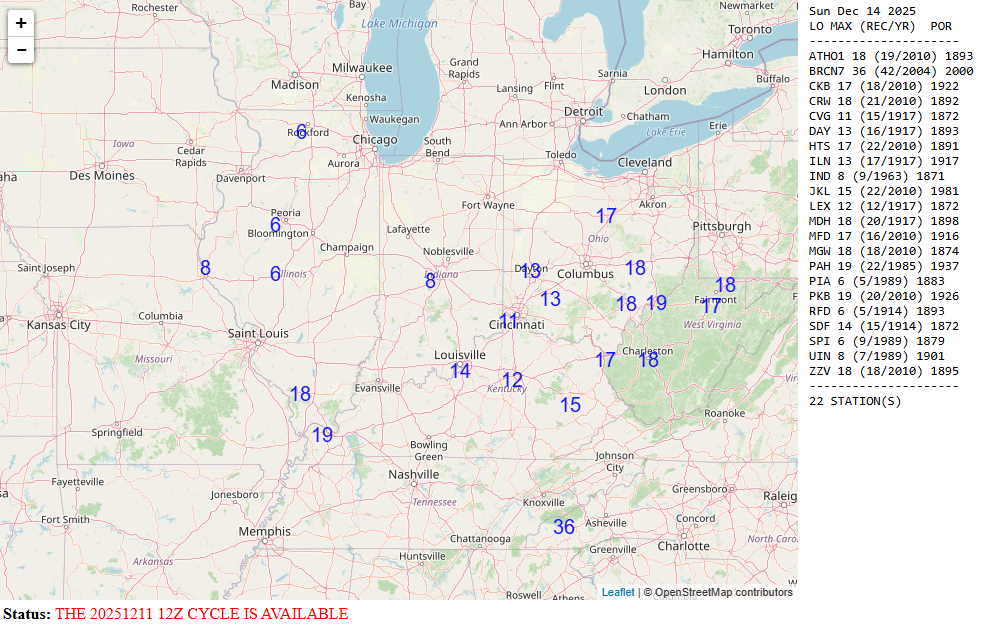
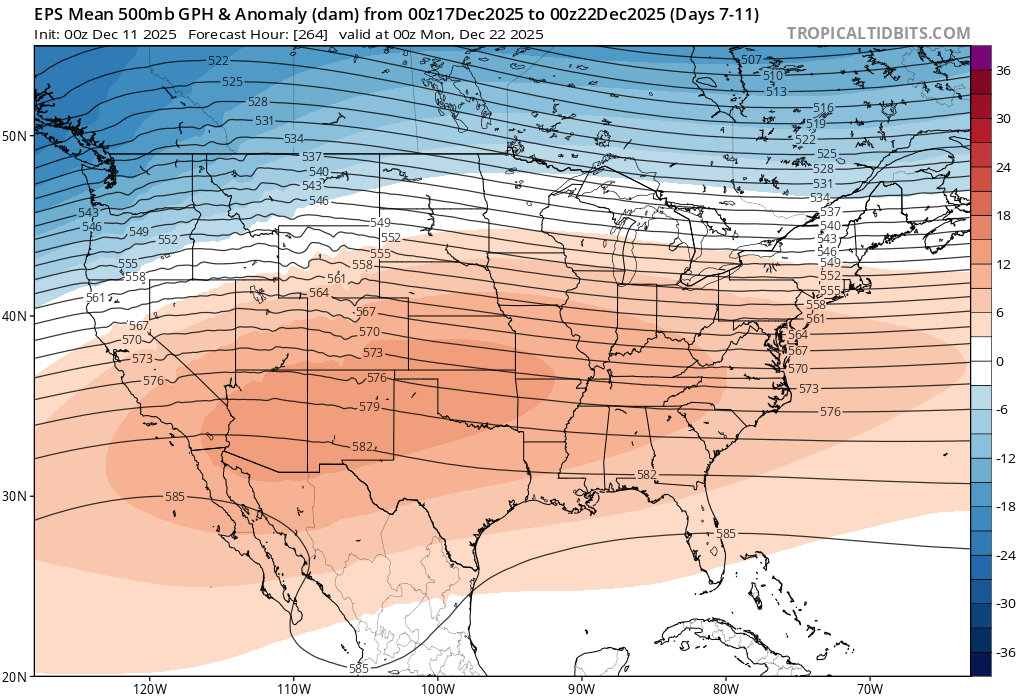
The rest of the country looks generally warm over the next 6 to 10 days, with average temperatures well above normal and a flurry of new record highs expected.
Will the pattern change at all as we roll into 2026? We’ll see. For now, just buckle up for a wild ride out West and a warm one for most everywhere else.
Newsy bits
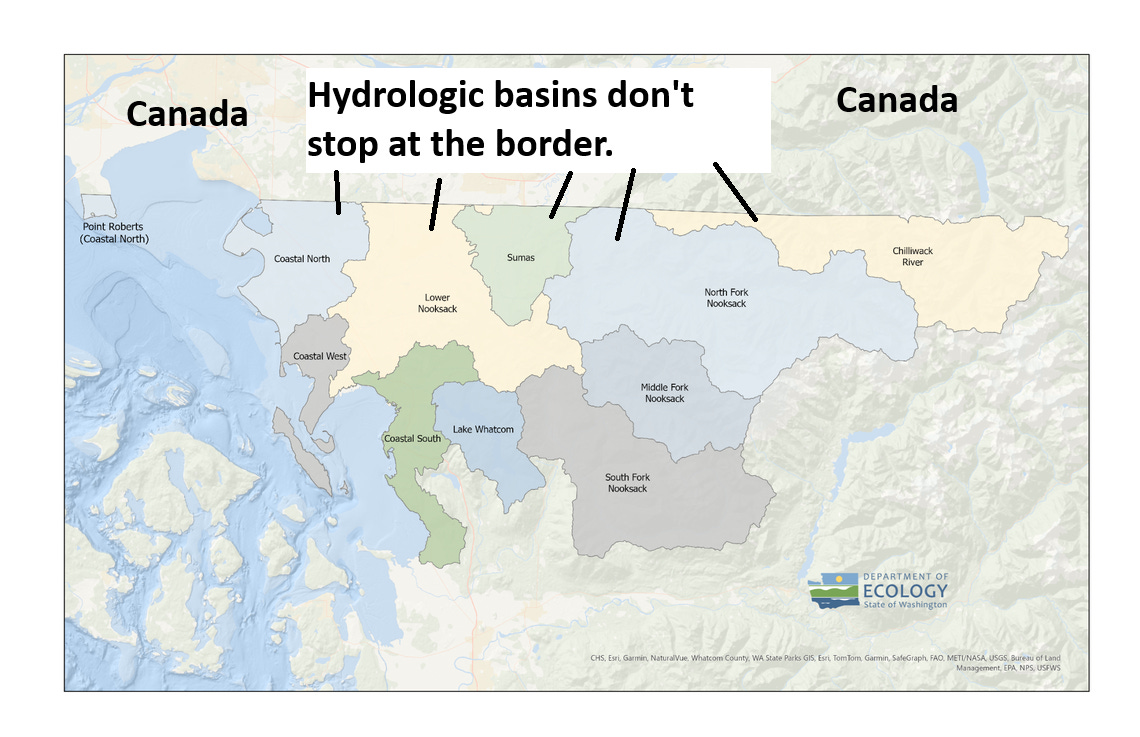
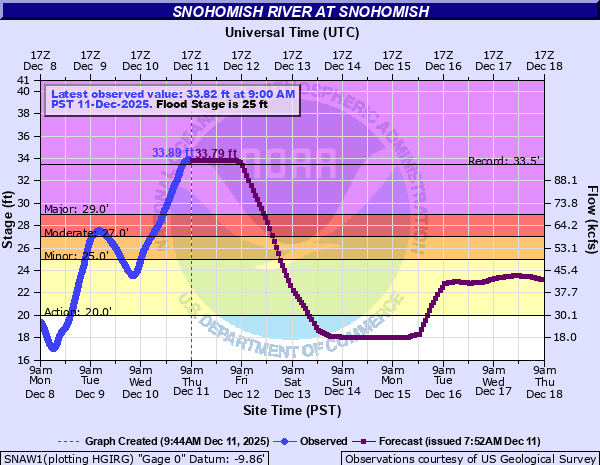
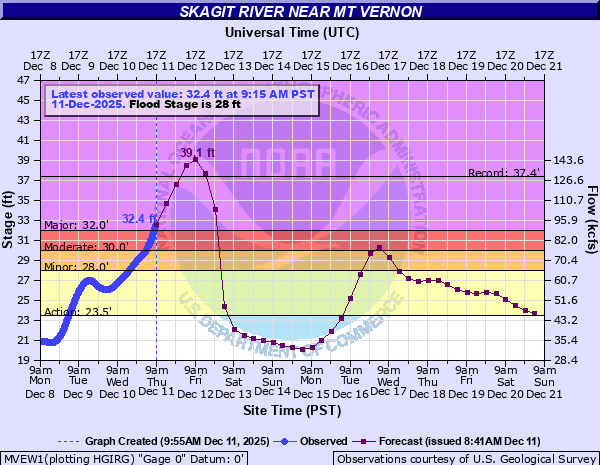
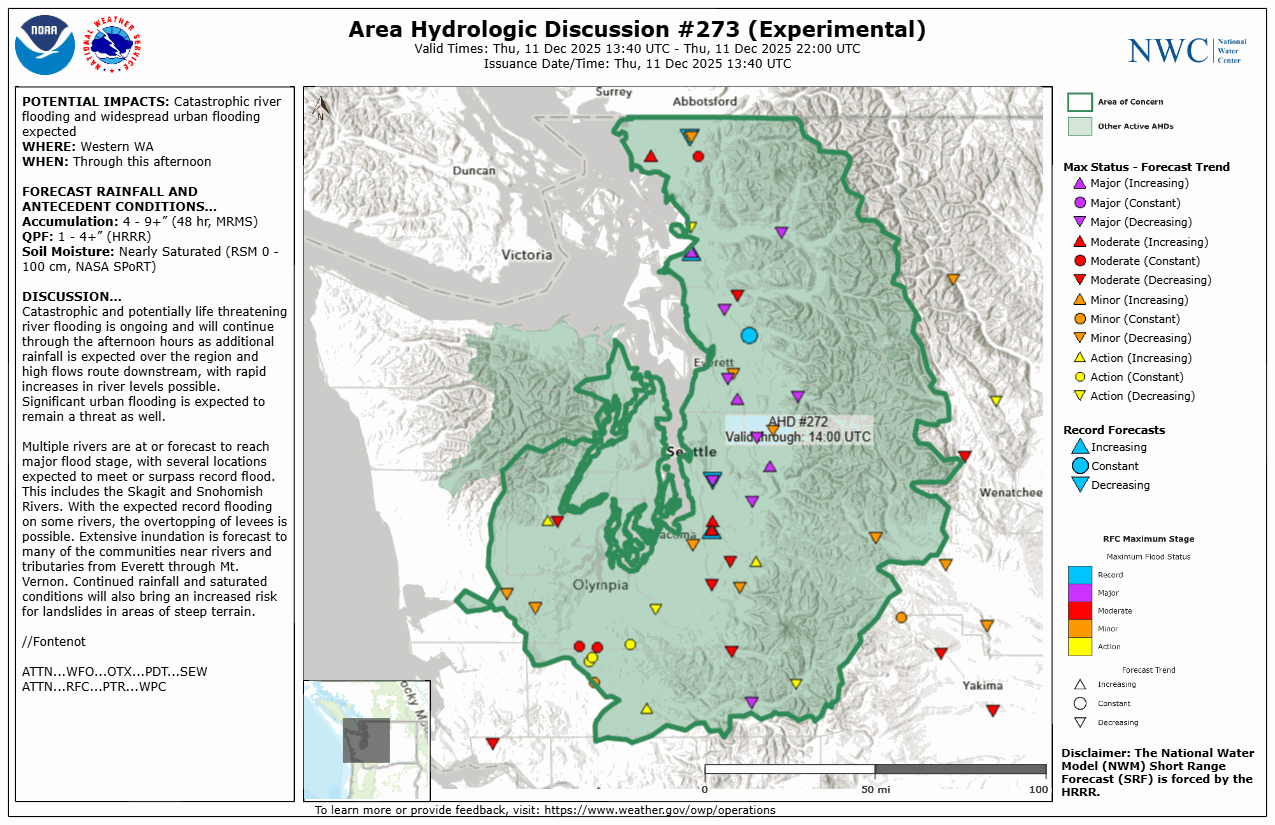
Whatcom County, WA: In Washington, the governor toured damage in Whatcom County from the recent record flooding that occurred in that area. As is often the case, a lot of good things were said after local, state, and tribal officials met, but the real test will be if any of it leads to changes.
Fraser Valley, BC: Meanwhile, over the border in British Columbia, the province’s premier echoed frustration with Canadian federal government inaction on the repeated flooding that is occurring there due to overflow from the Nooksack River into the Sumas Prairie and eventually Fraser Valley. The premier also spoke to Washington’s governor. It appears any concrete relief is going to have to occur with cooperation between the U.S. and Canadian governments.
Denver & Phoenix: Denver and Phoenix have little in common, being on opposite ends of the Colorado River politics spectrum and in different basins of the river entirely. The two cities are scrambling to future-proof their water supplies as the basin’s crunch deepens and negotiators have missed recent deadlines on how to share a shrinking river that 40 million people depend on. Both cities are quietly embracing solutions, from reservoirs to grass removal and planning for the potential of water cuts.
Mount Dora, FL: An update on flood damage from a very localized major flooding event earlier this autumn that occurred north of Orlando.