In brief: An upgrade to a moderate risk of flash flooding was triggered for Thursday in the Mid-Atlantic, including DC, Baltimore, Philly, and much of Jersey. The tropics remain quiet, but heavy rain is likely to pester the Southeast heading into next week.
For the latest on the tsunami and major earthquake last night, I’m going to point you elsewhere. There are plenty of good seismologists and geologists out there that can explain much of what happened better than this meteorologist. A number are active on various social media platforms, good people to seek out to understand this stuff. Meteorologists are often the ones used to explain various earth and astronomical events, often because we’re just generally decent science communicators. But there are so many others out there that are better at those events than us. You don’t want an astronomer explaining molecular biology to you, so no difference here.
Mid-Atlantic flooding risk Thursday
I want to start our weather discussion this afternoon with some updated news. The Weather Prediction Center has upgraded tomorrow’s flash flooding risk in the Mid-Atlantic from slight (2/4) to moderate (3/4). Data today has come in pretty aggressive with potential rainfall tomorrow between northern New Jersey and northern Virginia.
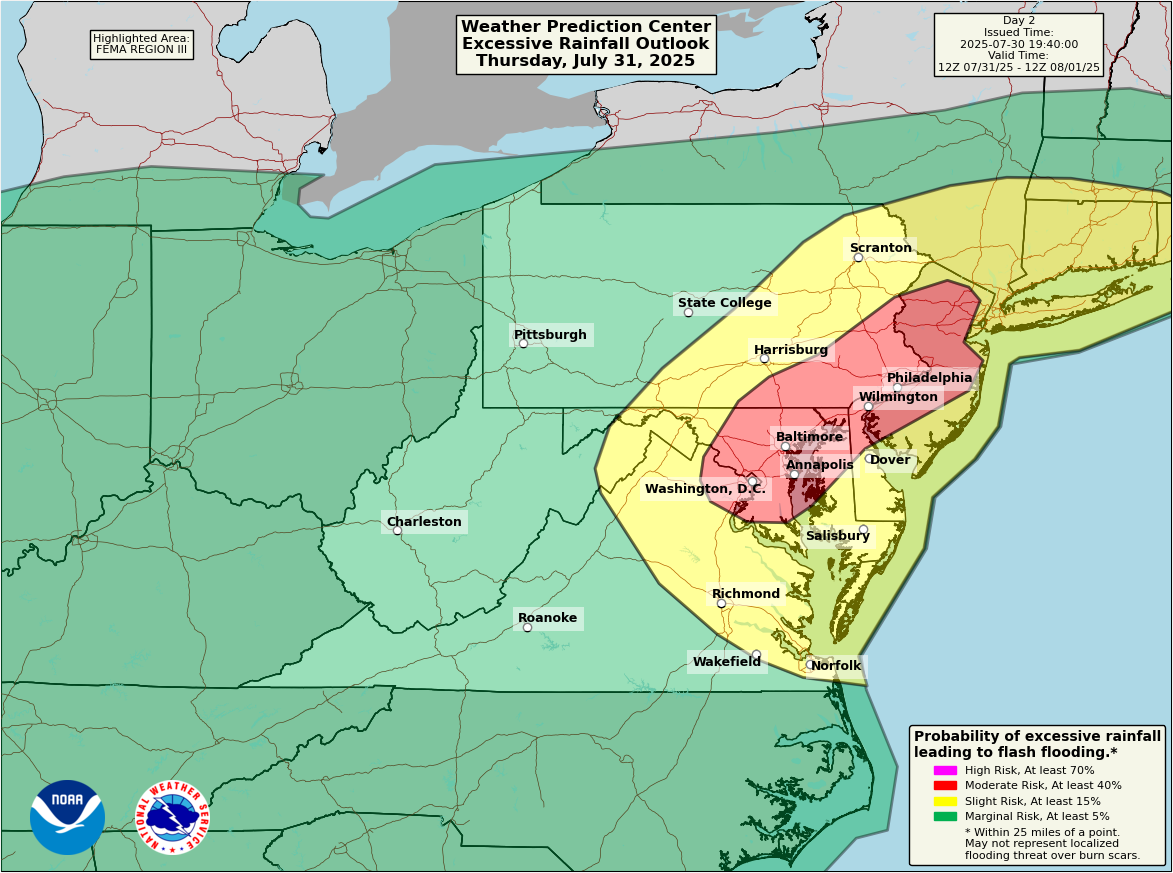
This risk area includes Washington, DC, Baltimore, Philly, and most of the I-95 corridor southwest of New York City. Per the WPC discussion, with the area lying sort of close to a couple key meteorologically supportive areas for heavy rainfall, this sets the stage for impressive rain totals, some training thunderstorms (storms that repeatedly travel over the same locations), and an urban area that is naturally prone to flash flooding. Flood watches have been issued today for Thursday’s storms.
Looking at model data, it’s pretty clear that while the entire region will see some rain, the biggest concerns will be in isolated pockets between northern Virginia and northwest New Jersey.
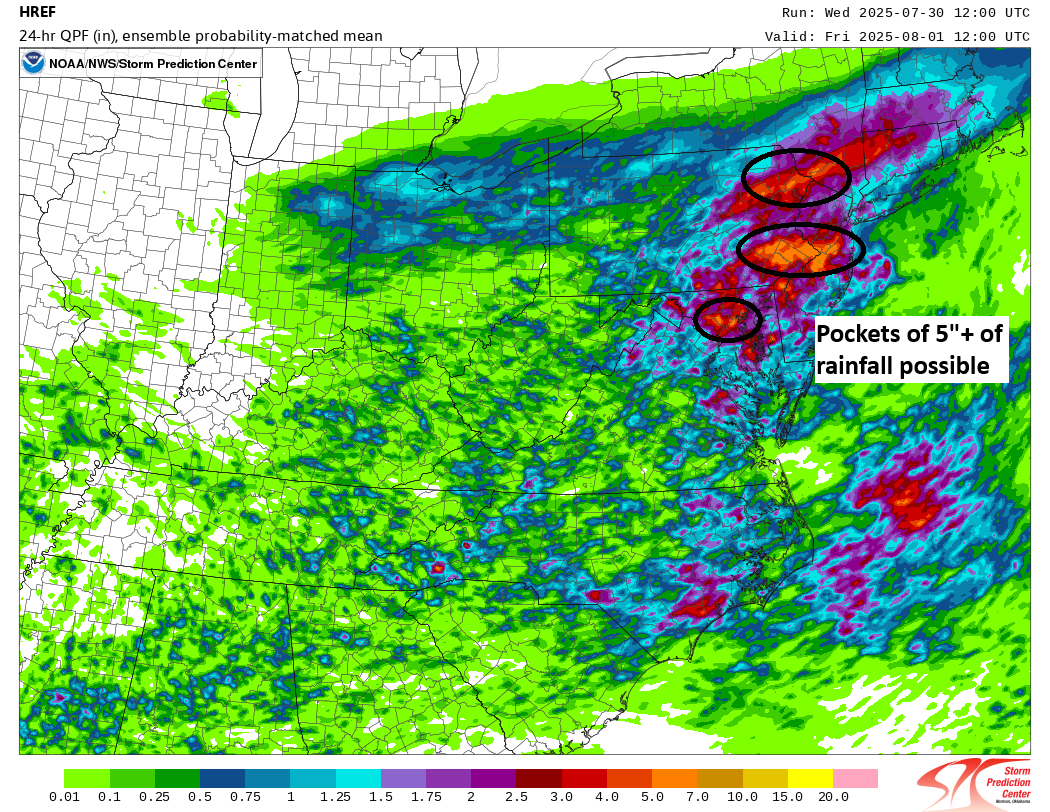
The HREF model shown above which is an ensemble of a few high-resolution models produces a product called the probability-matched mean, which tends to flag areas of higher risk and what those totals could be. And indeed on this morning’s run, it shows legitimate potential for 5 inches or more in pockets around DC and Baltimore, as well as near and north of Philly. Exactly where those higher totals establish is very much up in the air this far out. But this is why the moderate risk covers a broad area in parts of the Northeast Corridor. Even in areas under the lesser slight risk (2/4) should take heed that heavy rain is possible, if not likely tomorrow, including southern New England and parts of New York State south of Albany and into the Catskills.
Bottom line: Flooding potential is very elevated tomorrow in the Mid-Atlantic, so stay on your toes and be alert.
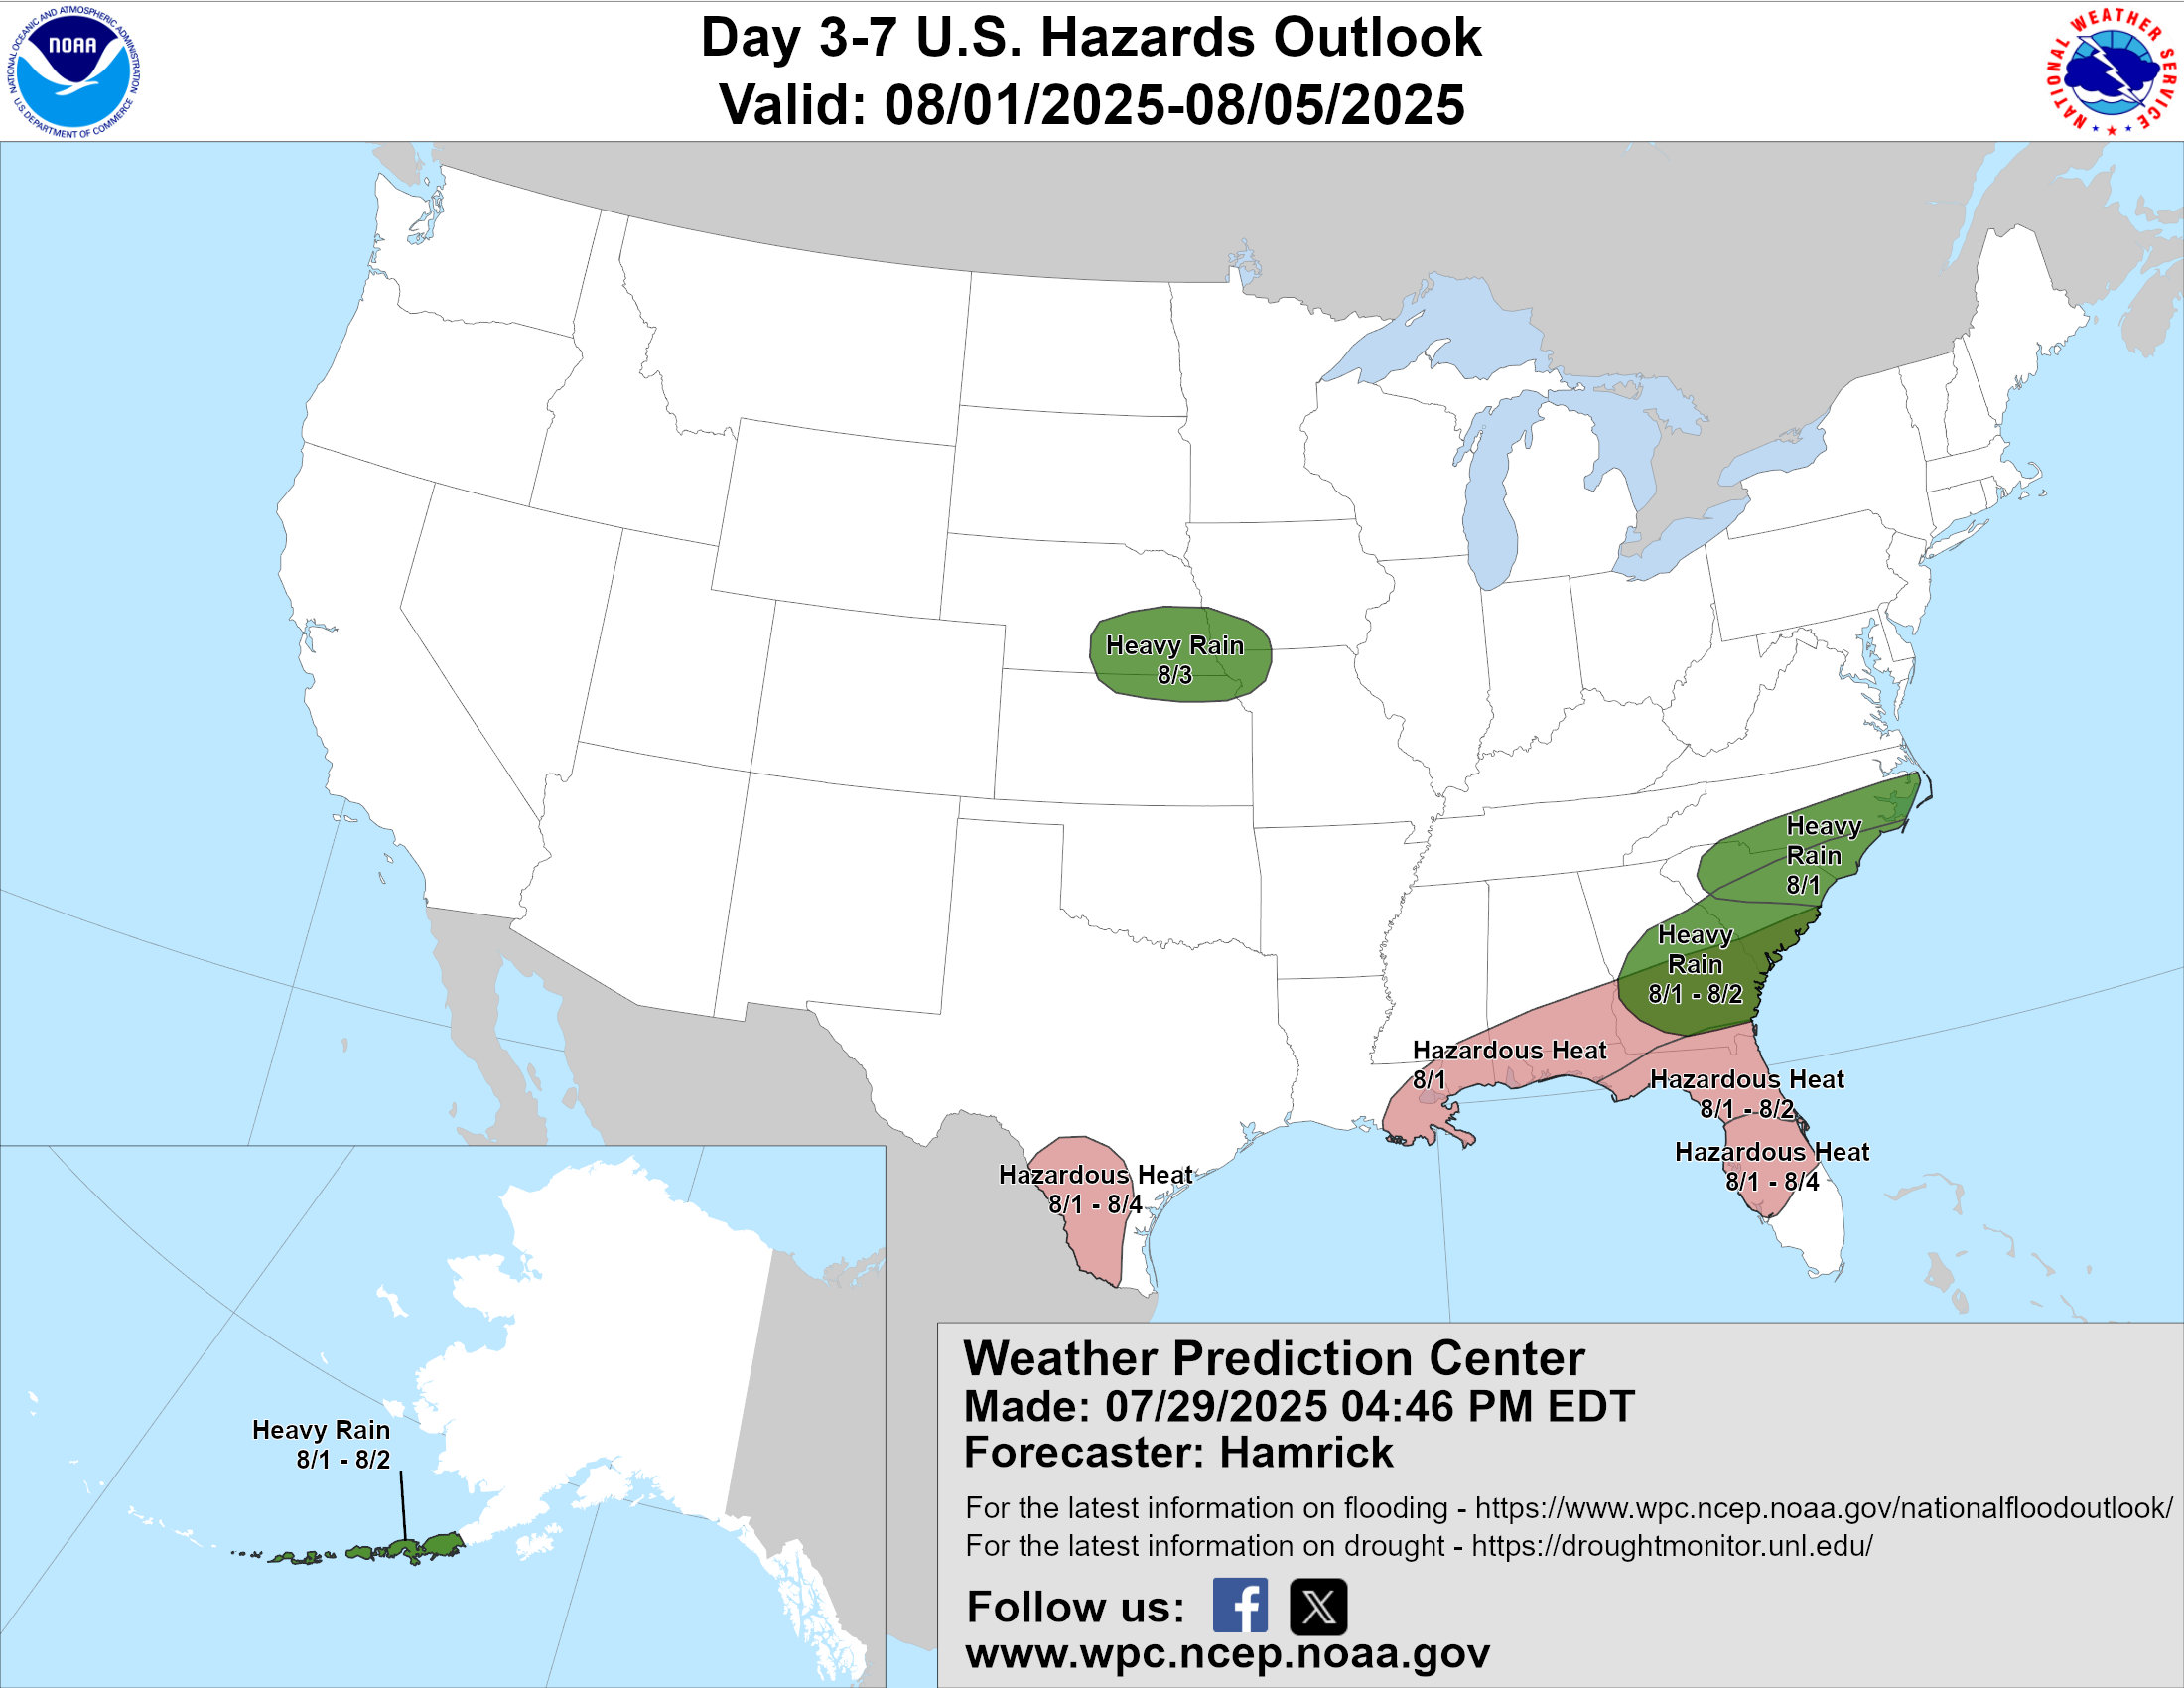
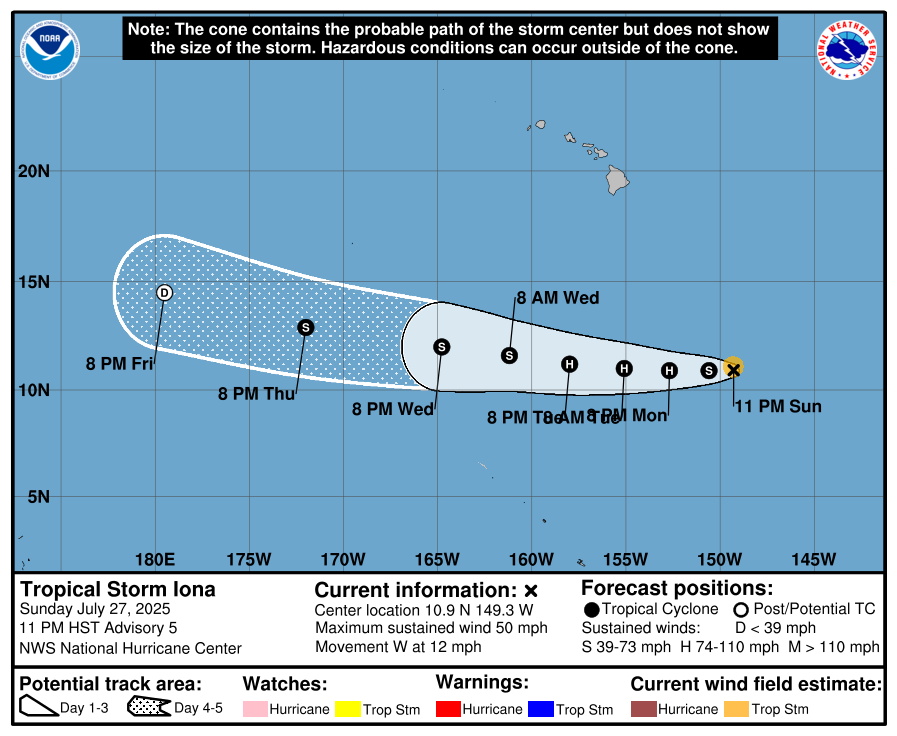
Tropics remain calm
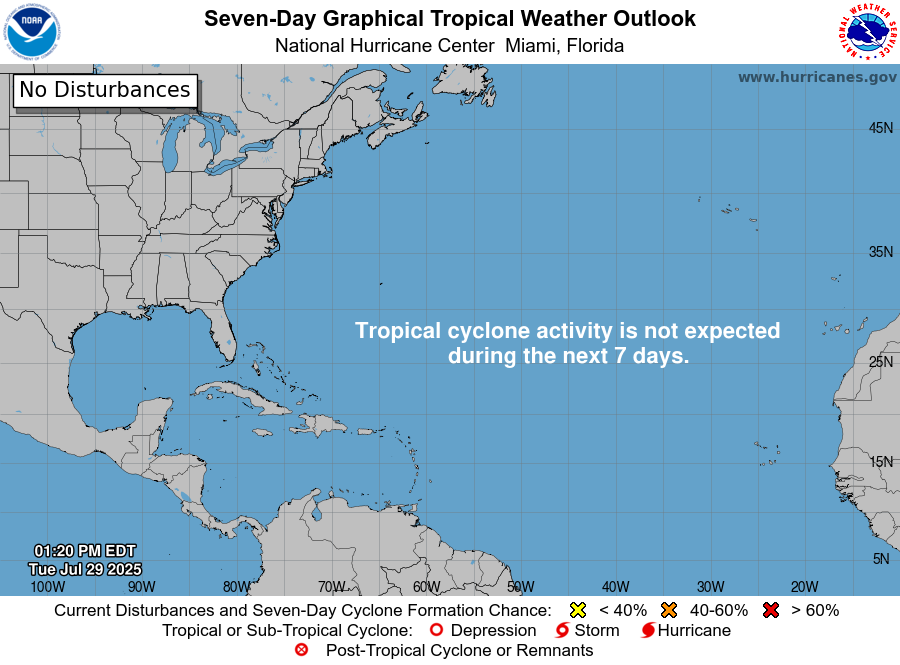
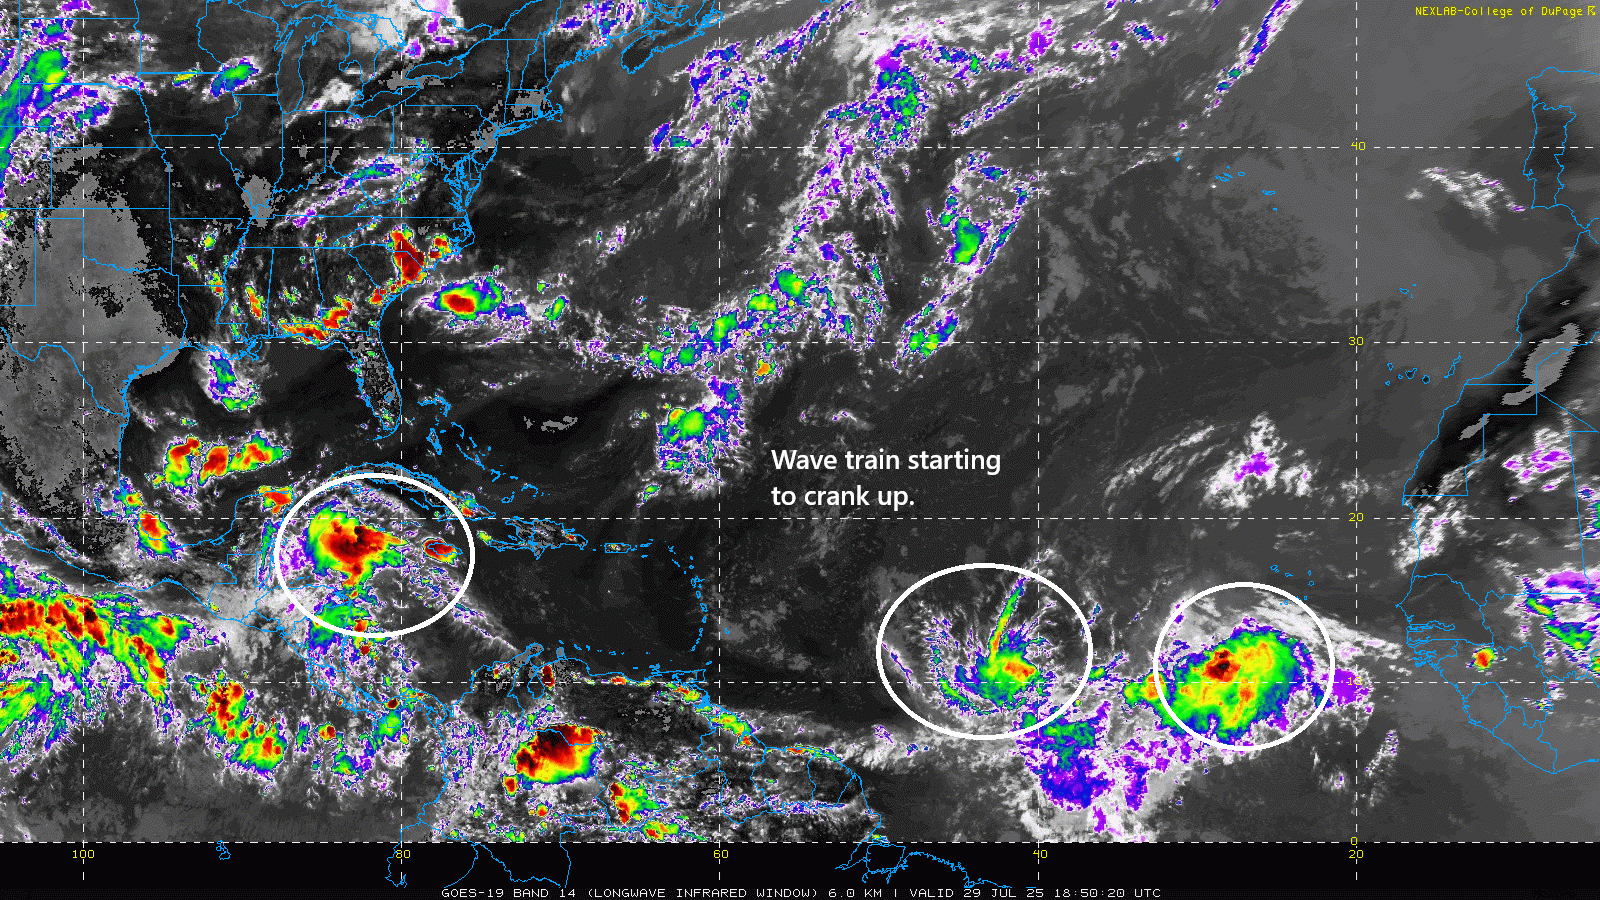
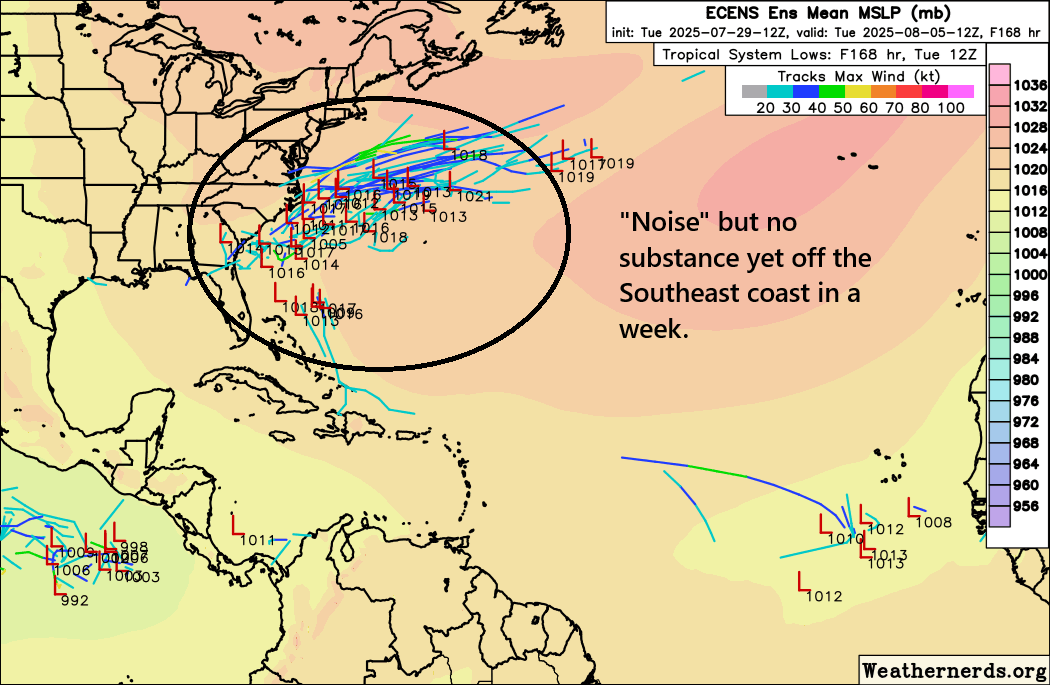
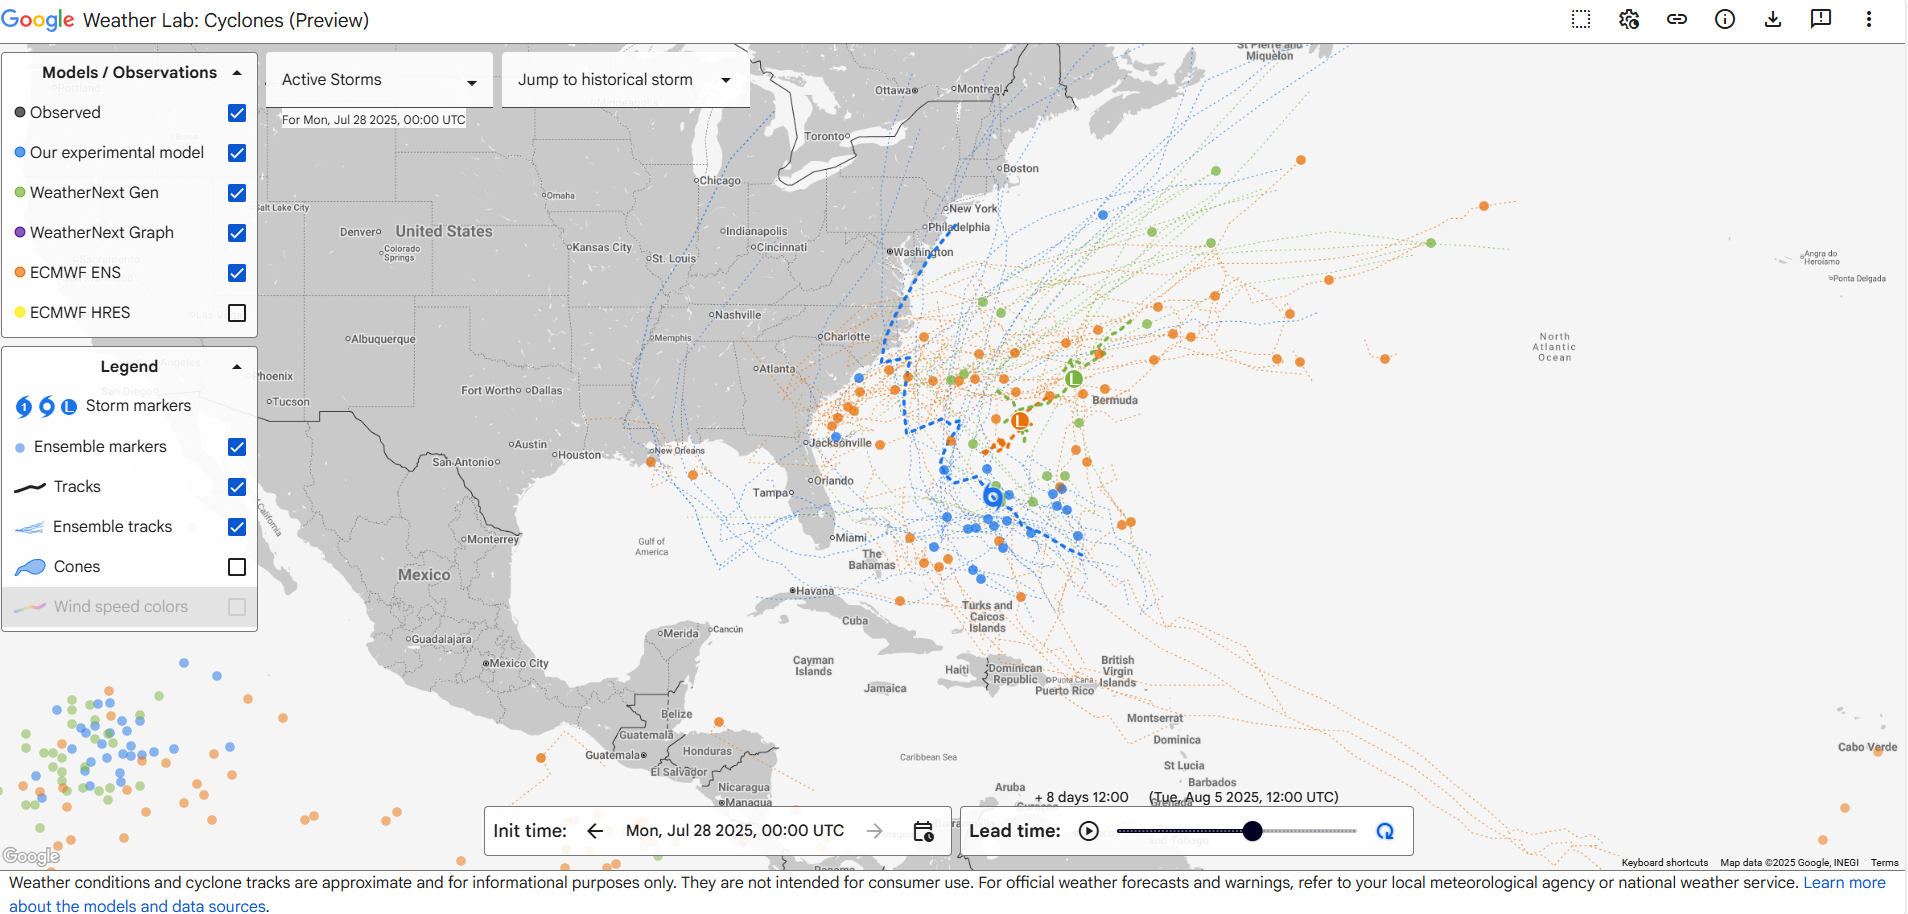
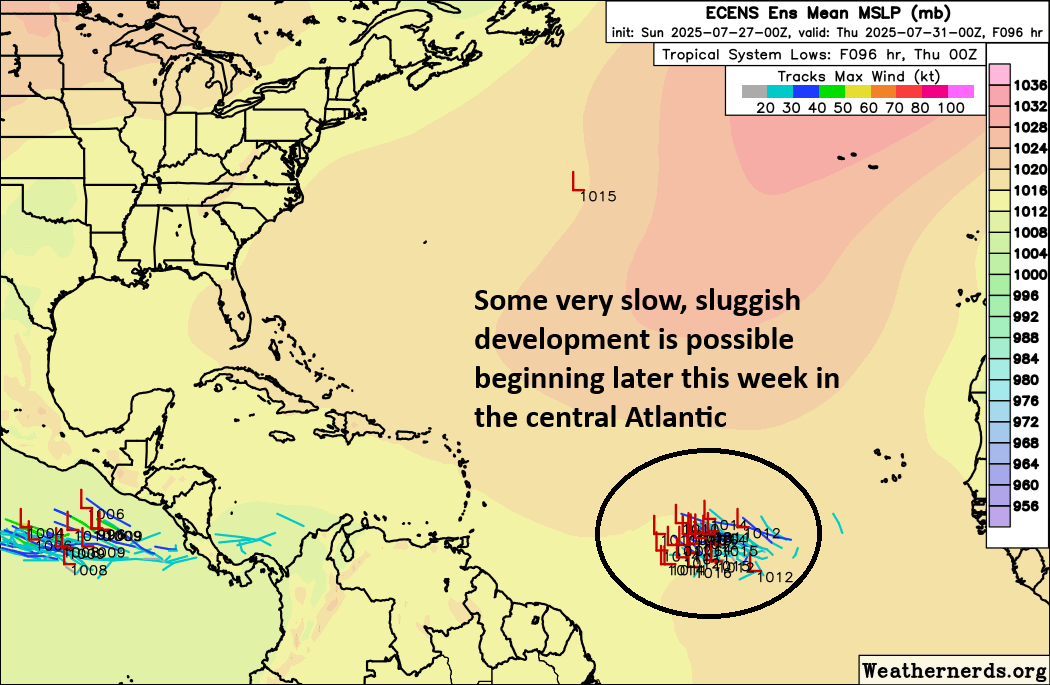
All remains quiet in the Atlantic with no highlighted areas anywhere in the Basin for the next week. We continue to see “noise” on the modeling off the Southeast coast next week, but any system would likely pull east out to sea. Nothing to home in on beyond that right now.
We will see heavy rain as a result of the pattern setup along the Southeast coast. This is probably why the models are latching onto some sort of low-end potential in that region next week. Anyway, the rain will bring probably 3 to 5 inches of liquid to much of the Southeast or southern Mid-Atlantic.
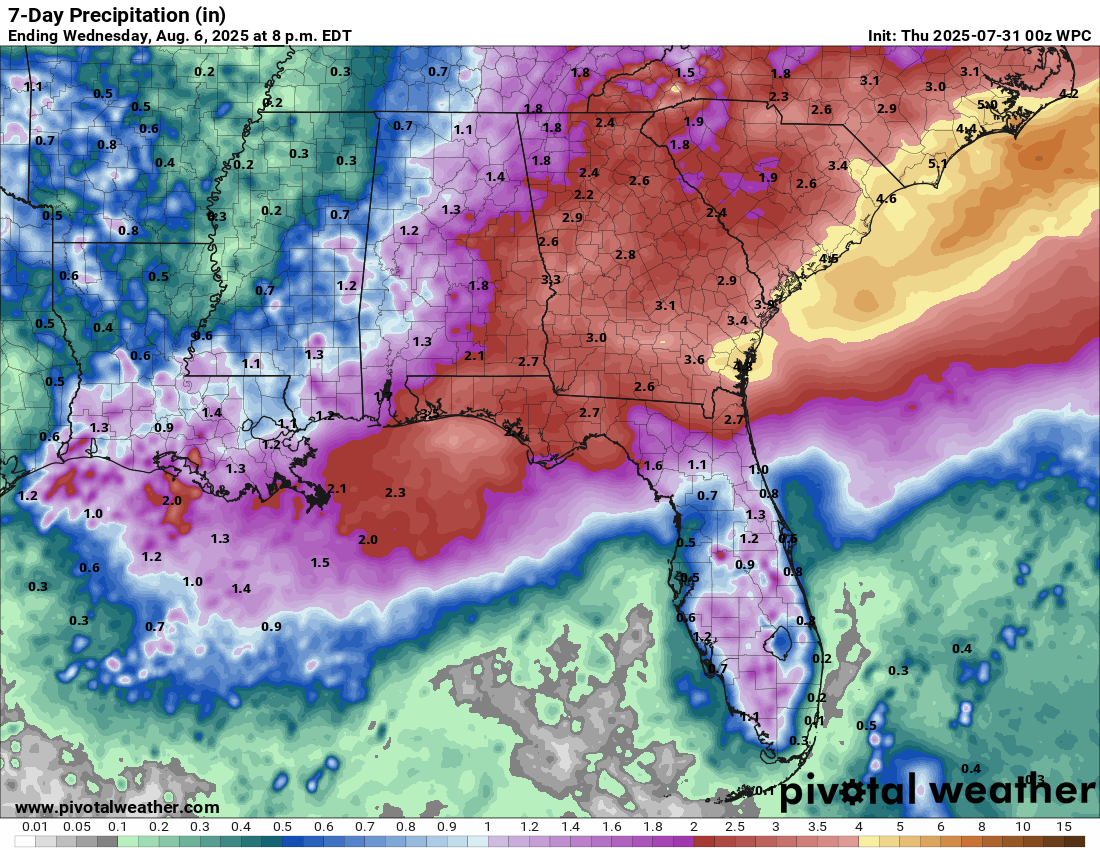
The heaviest rains look to be on the Carolina coast with 4 to 6 inches possible from the Outer Banks south to Savannah.