In brief: This evening we discuss the situation in the Pacific Northwest, with severe flooding developing. We also have a bunch of links to information on the recent news about the Colorado River, as well as an Eyewall curated book list to better fully understand the water situation in the West. That and more downstairs.
It’s been a minute. How are you? Good, I hope? Excellent. So one thing I had planned to do lately was write a rather thorough post about the Colorado River situation, which I personally believe is important for us all to understand. Instead, I’ve really just found so many other people, more well-versed than me on the topic have done outstanding work summing things up.
First, my contribution besides a bunch of links? I want to present a book list for you. I put this together on Bookshop.org (Full disclosure: If you order off this list, it may provide a small commission to us):
The West and Water: 16 books to help you better understand the water situation in the West
I curated 16 books that I have either read, am reading at present, or am intending to read. Each book on this list will provide some context toward understanding the water issues in the Western half of the U.S. If you need some holiday gift ideas for yourself or others, this may help a bit! Or so I hope it does. Anyway, it’s such an important topic, and I think it’s critically important that anyone with an interest in nature, water issues, survival of civilization, or the West broadly should read more to learn more. It’s a fascinating topic as well, and so much, so many competing interests are involved with it.
And it’s a mess right now…
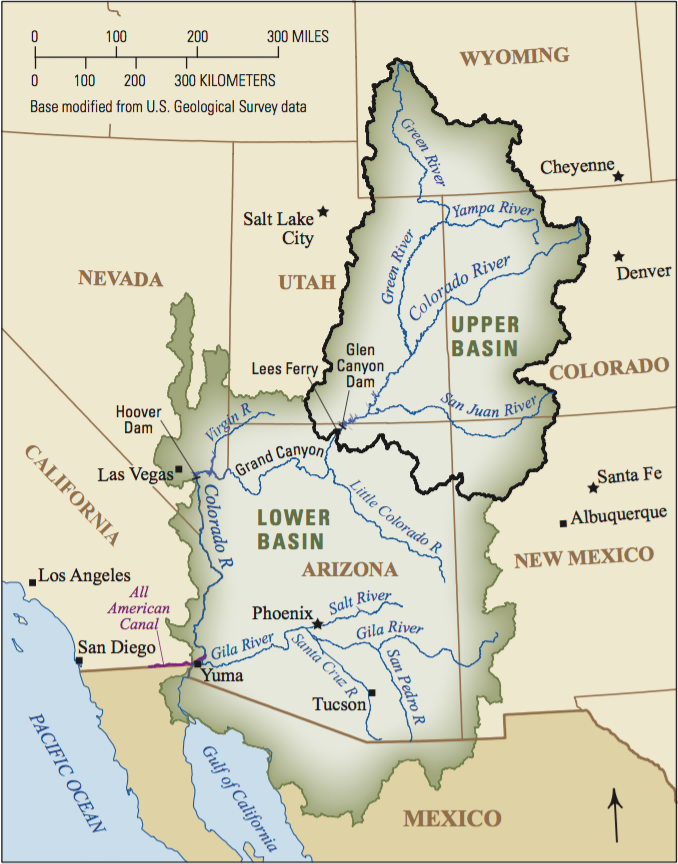
In 1922, the Colorado River Compact was established, which, in addition to numerous court cases and other laws and treaties decided since then has created what is known as “The Law of the River.” Key players have been negotiating on a new long-term operating strategy for the Colorado River. In 2007, Interim Guidelines for Lower Basin Shortages were established in response to increasing drought. Those rules have governed things since, and those guidelines expire at the end of next year. Thus, we’re in negotiations now. It’s a process that’s been ongoing for years now, and we just passed a key deadline on November 11th to reach an agreement. That did not happen. But if an agreement cannot be reached, the solution would come from either the federal government or the Supreme Court. Few want that, so they have opted to go into overtime on negotiations to try and avoid that outcome. Of course, not all feel this way. Arizona has stepped in and said they want the government to broker a resolution to the issues because, as Governor Katie Hobbs has put it, “Not only do they (the Upper Basin) refuse to commit to any water use reductions, they tell our negotiators that it is too complicated and impossible for them to reduce water use. And I have a really hard time believing that.” It’s messy.
So, how to make sense of everything? Here are some links.
The Phoenix New Times also has a nice article explaining what’s going on right now.
The Colorado Sun takes a look at what’s next for overtime.
The Sun also discussed what the sticking points were back in October.
High Country News also looked into why this is so difficult.
The Colorado River Research Group just published a report entitled “Dancing with Deadpool” that takes a lot of leading voices in the space and allows them some room to write about key issues.
The Water Education Foundation has a deep dive into issues and risk assessment.
Many of these articles discuss Indigenous issues, but here’s a specific document discussing Tribal Nation interests on the river, a critical piece of the puzzle right now.
A major issue related to this will be around the recent decision by Colorado River Indian Tribes of Arizona and California to declare the river has the same legal rights as a person. Regardless of how you feel about this, it will almost certainly find its way to court one day.
That’s a lot of books and a lot of links, but this is SUCH a complex issue, to fully understand it you need all this context. Anyway, if you find yourself wanting to understand this better, that’s a lot to help right there. Hopefully you find it interesting and valuable.
Pacific Northwest major flooding
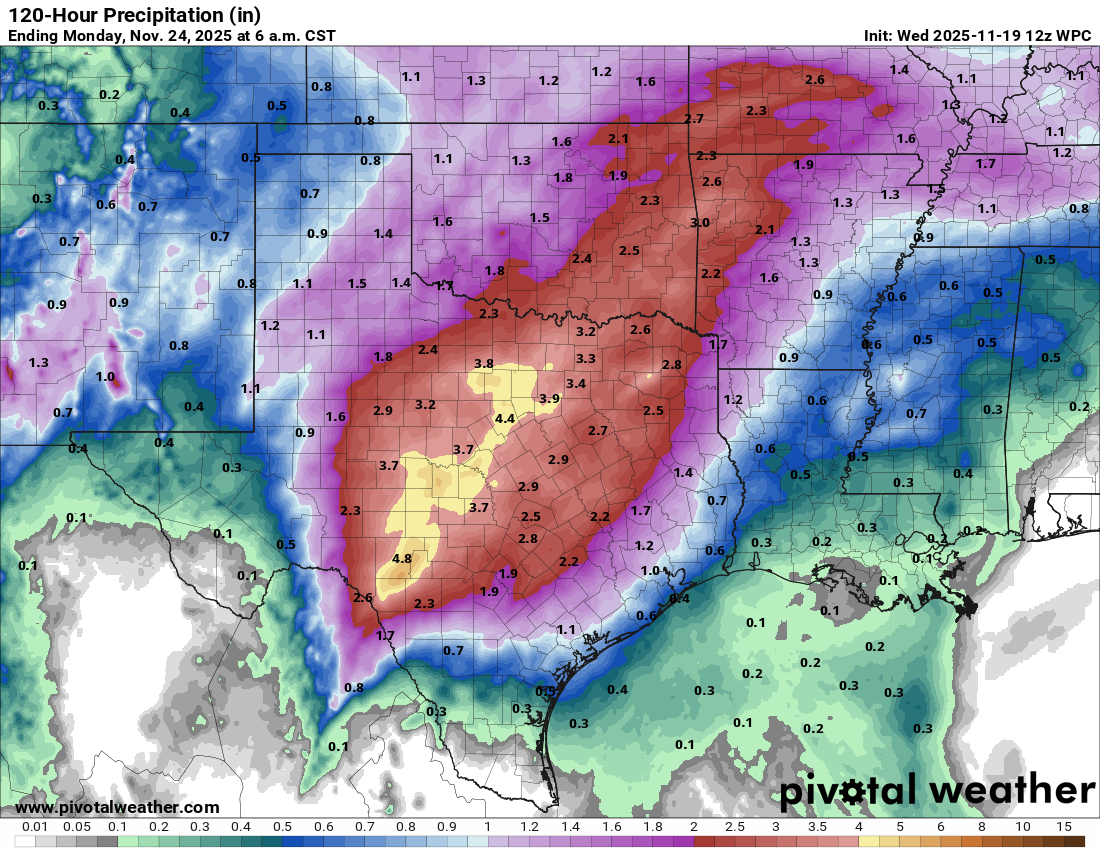
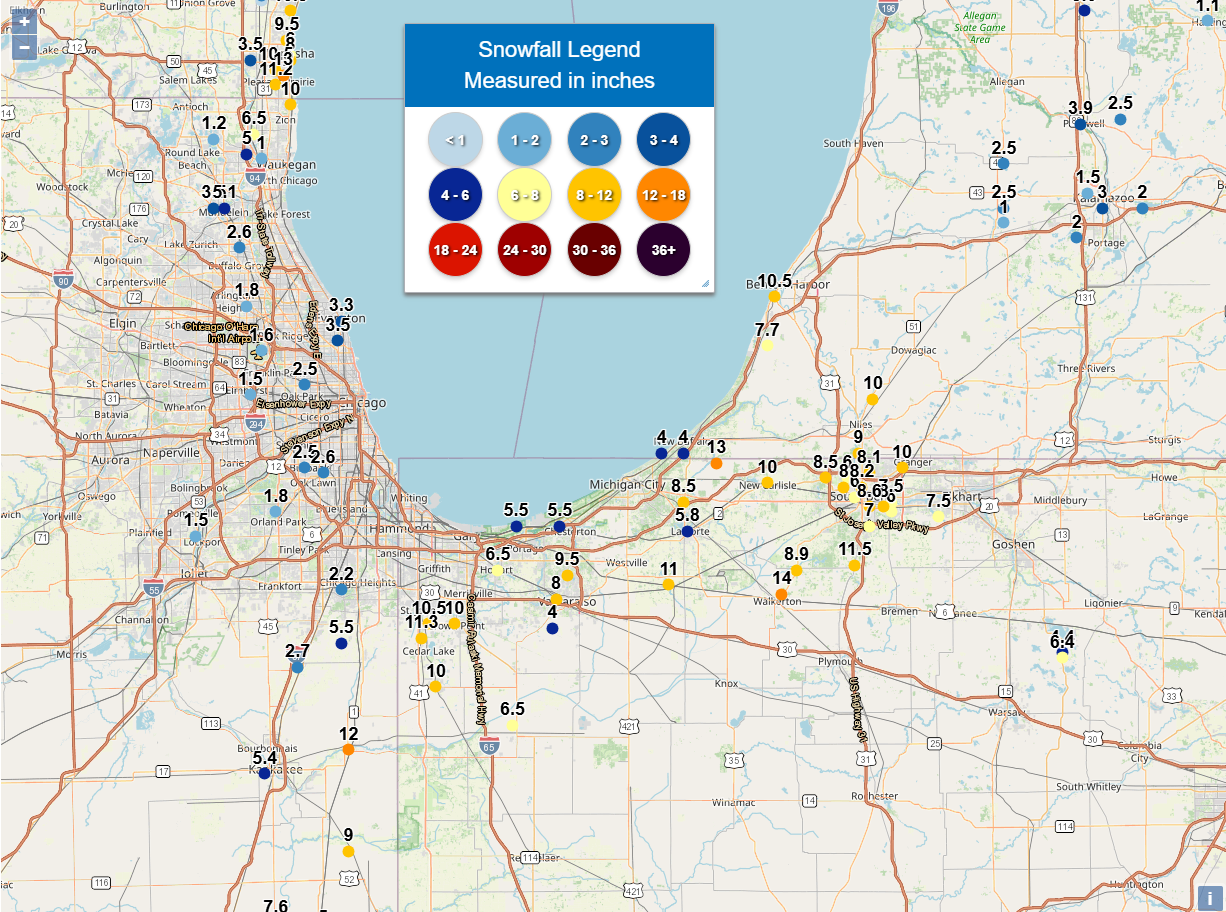
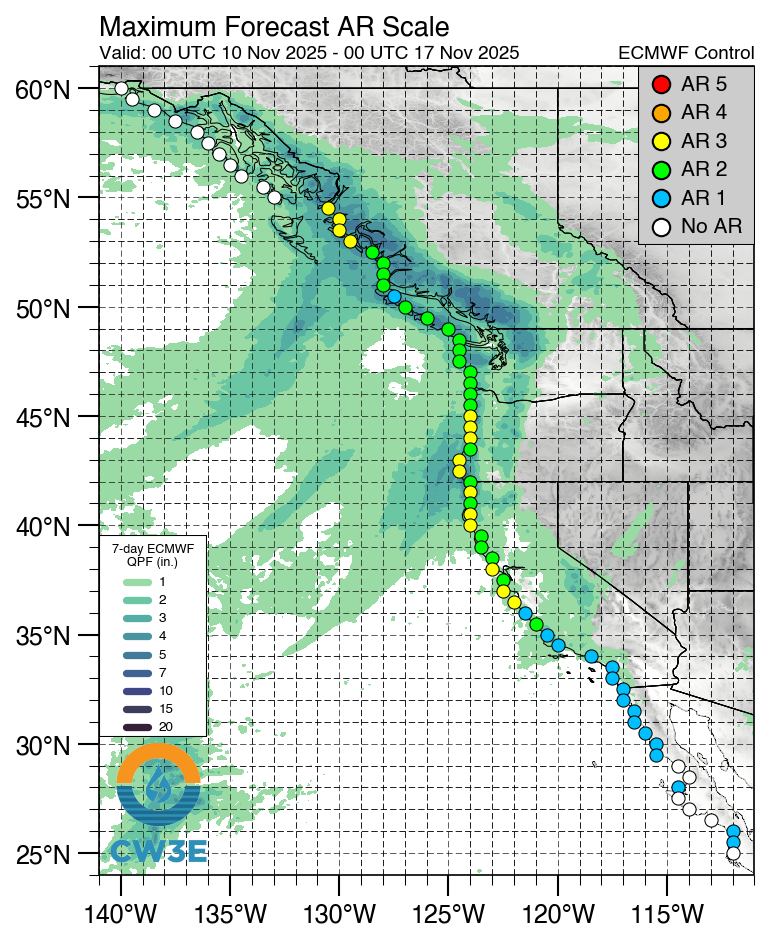
In the weather-world, it’s quite active. Right now, the focus is on the Pacific Northwest, which is getting absolutely crushed by an atmospheric river. Spike one just occurred this week. Spike two is inbound tonight and tomorrow.
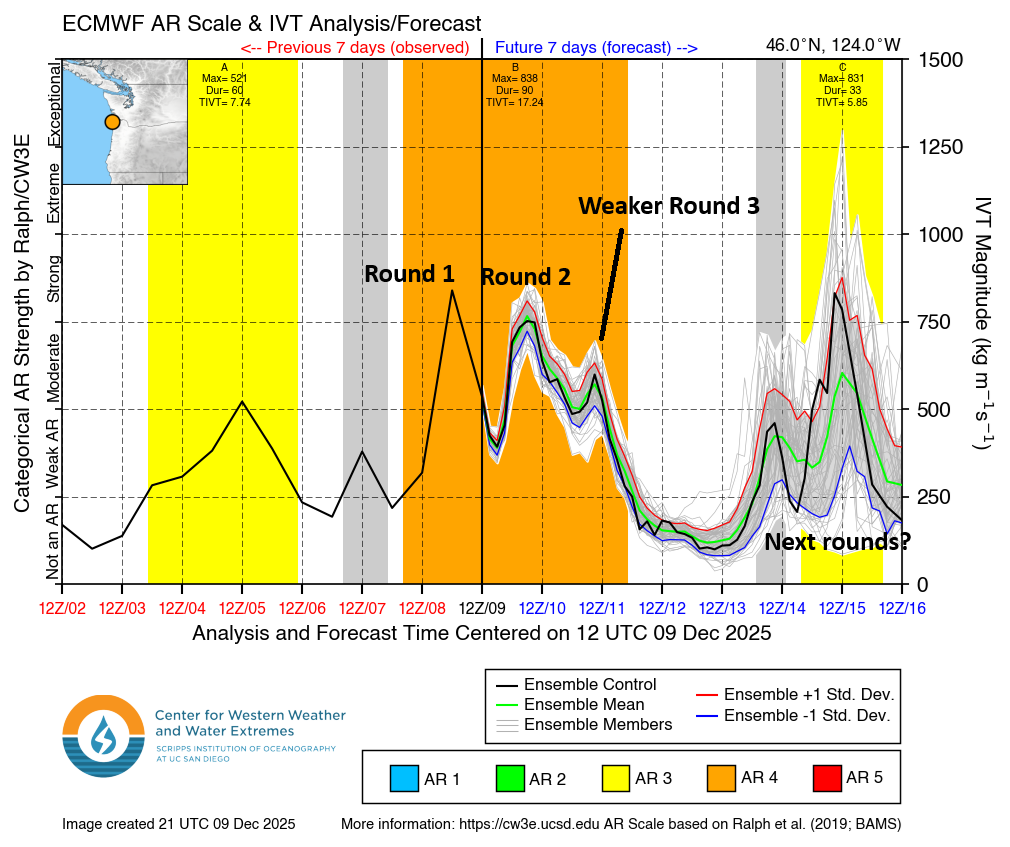
This next round will deliver a substantial amount of rain as well as mountain snow. The snow levels will be up around 5,000 feet or higher, which is a fairly warm storm. These types of heavy precipitation events that are warm can cause serious flooding.
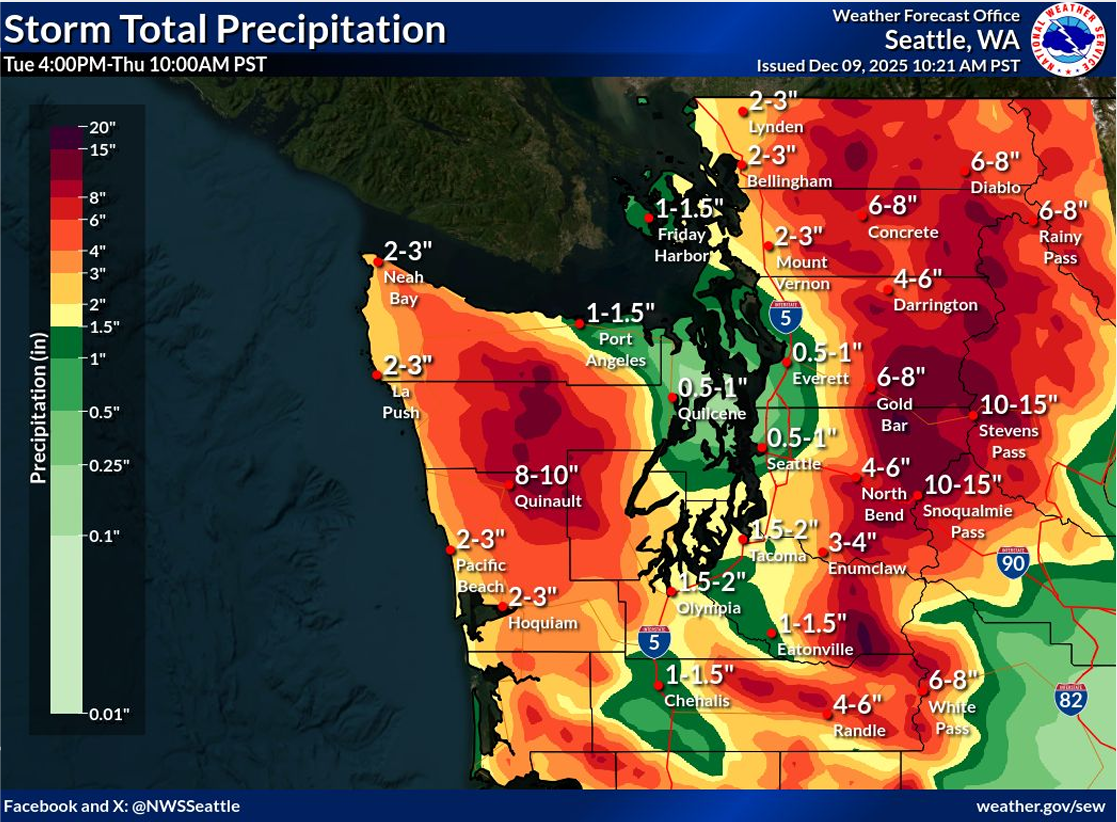
The flooding will be major to record on some rivers. For instance, the Snohomish River at Snohomish will reach around its record level of 33.5 feet set in November 1990. The Skagit River near Mount Vernon will likely smash its previous record, also from November 1990.
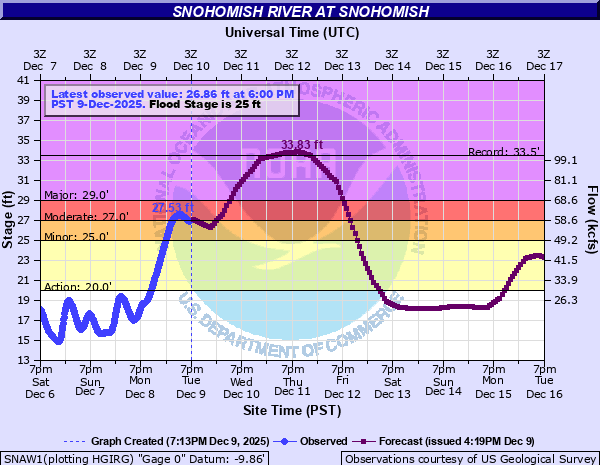
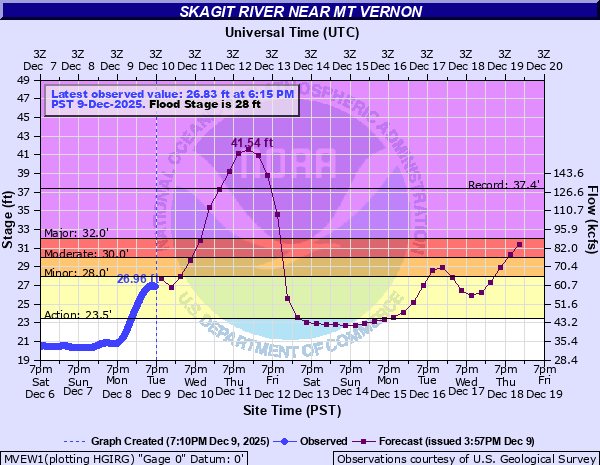
That Mt. Vernon hydrograph is rather concerning to be honest. Breaking a 35-year-old flood record by 4 feet is no small feat at all. The forecast can (and will) fluctuate based on how much rain actually falls, but it’s rather clear from the abundance of gauges near or above records that this is going to be a severe, if not historic flood event in western Washington. Landslides and debris flows in wildfire scars are also a concern.
Consult local media for a more detailed update on the situation, and follow the local NWS offices in Seattle, Spokane, Portland, and Pendleton for the latest. You can find the latest gauge forecast information at various locations in Seattle and elsewhere in Washington here.
Everything is sort of connected here, and this particular atmospheric river extends way, way out into the Pacific. The first in this wave of storms extended back to the Philippines, an area that has also been dealing with severe rains this autumn. The next one in line is a little shorter, but it’s still extremely impressive.
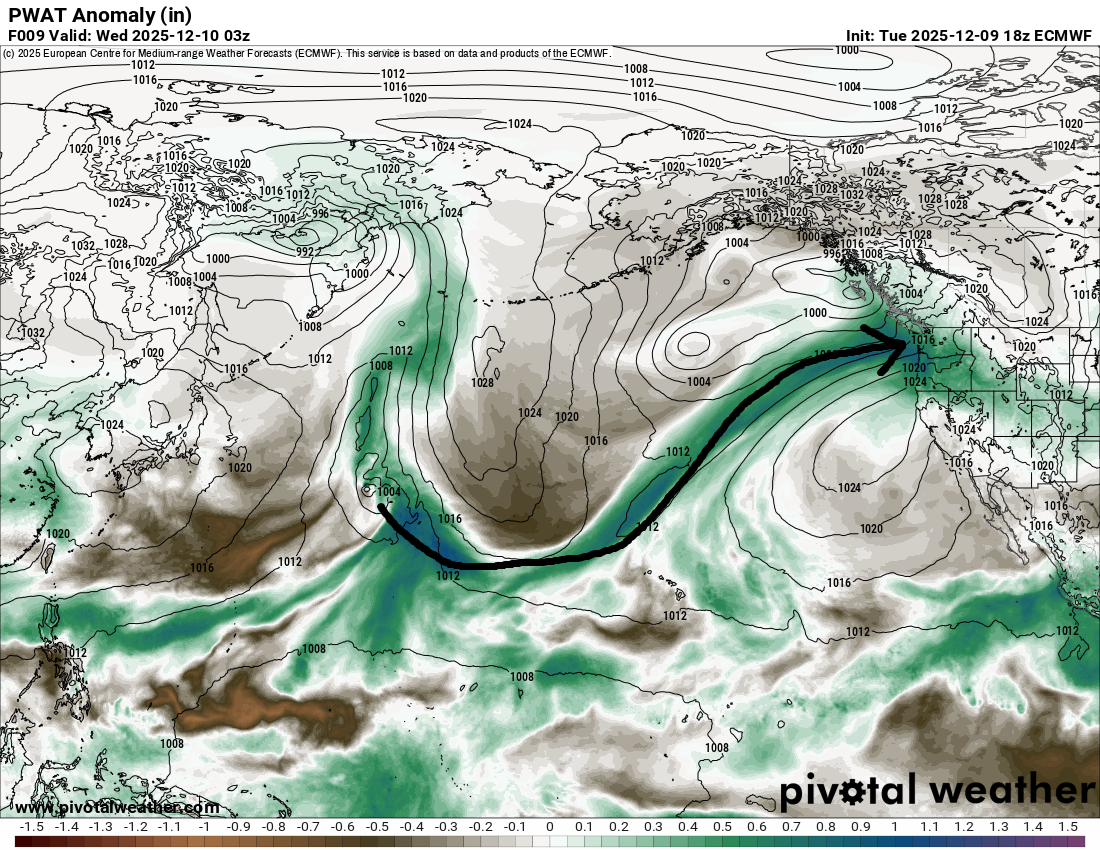
If you’ve followed weather globally, you’ve undoubtedly heard about flooding in the Philippines, Vietnam, Indonesia, Sri Lanka, Singapore, and elsewhere. In fact, if we look at how precipitable water anomalies have behaved since mid-October, it has been decidedly above normal from Southeast Asia across the Pacific into the Northwest.
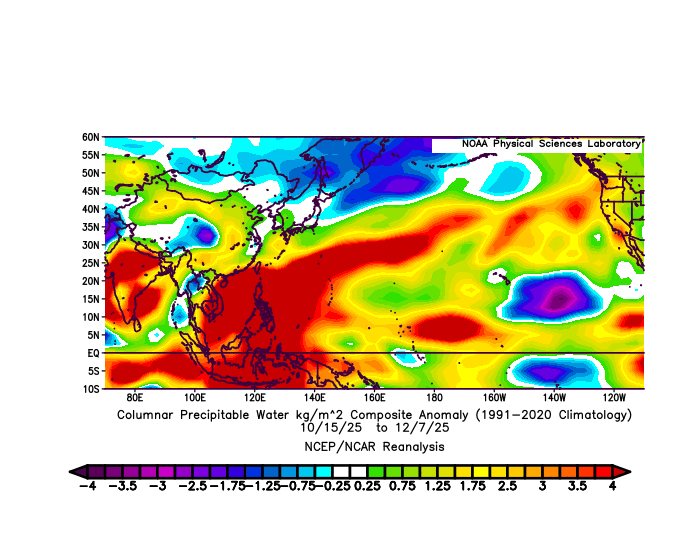
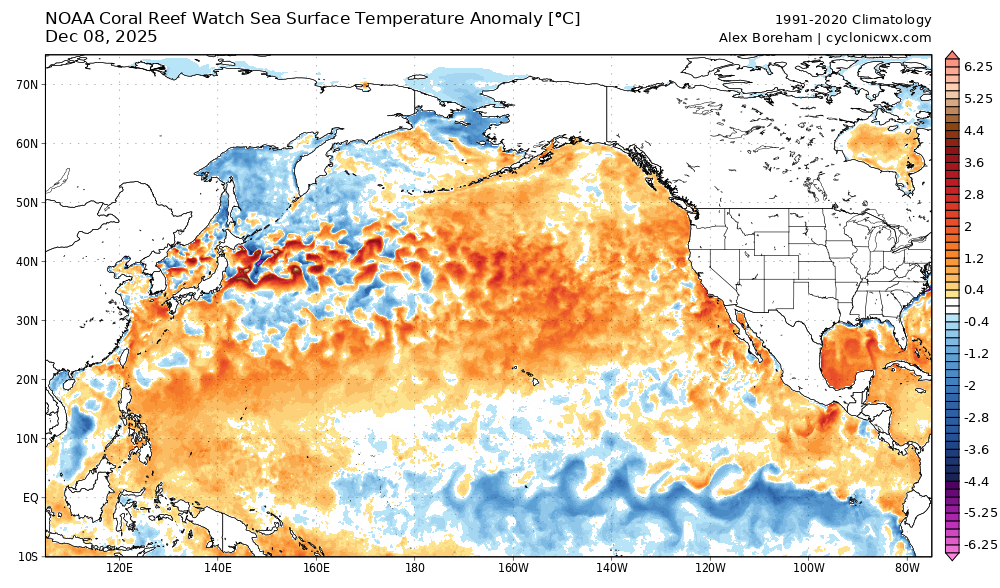
Clearly this pattern is juiced right now. The warm Pacific Ocean is not hurting this cause either. Warmer than normal water extends from the Philippines to north of Hawaii to the West Coast. It’s tremendously moisture-laden at the moment.
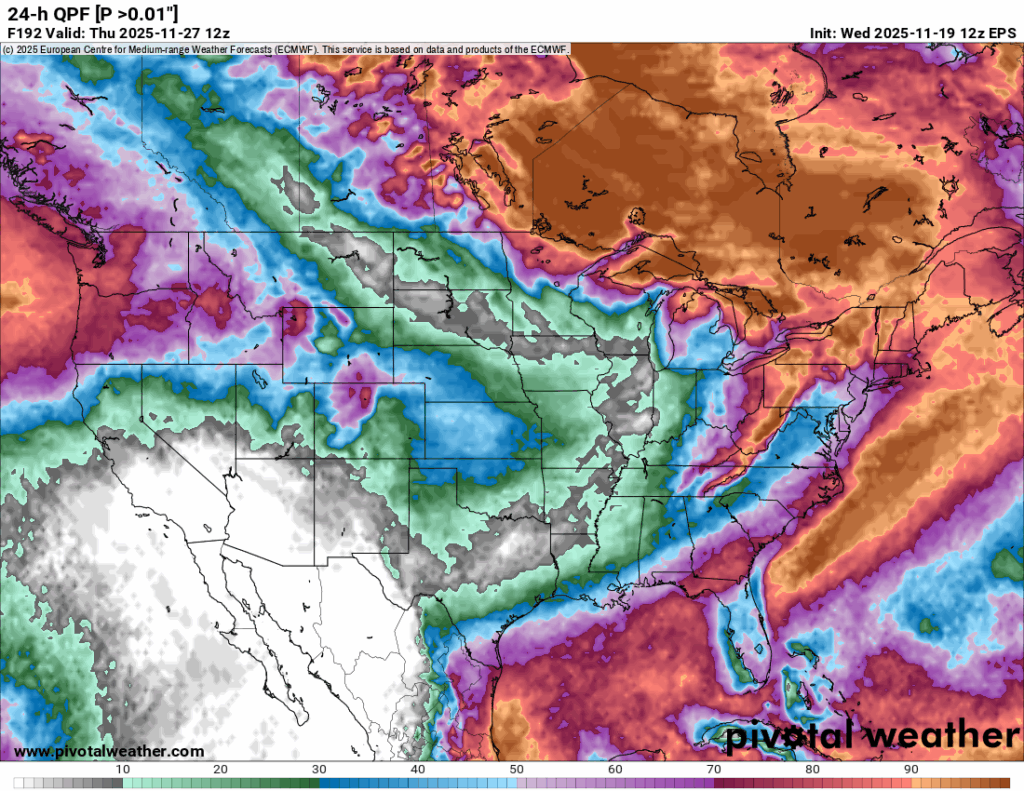
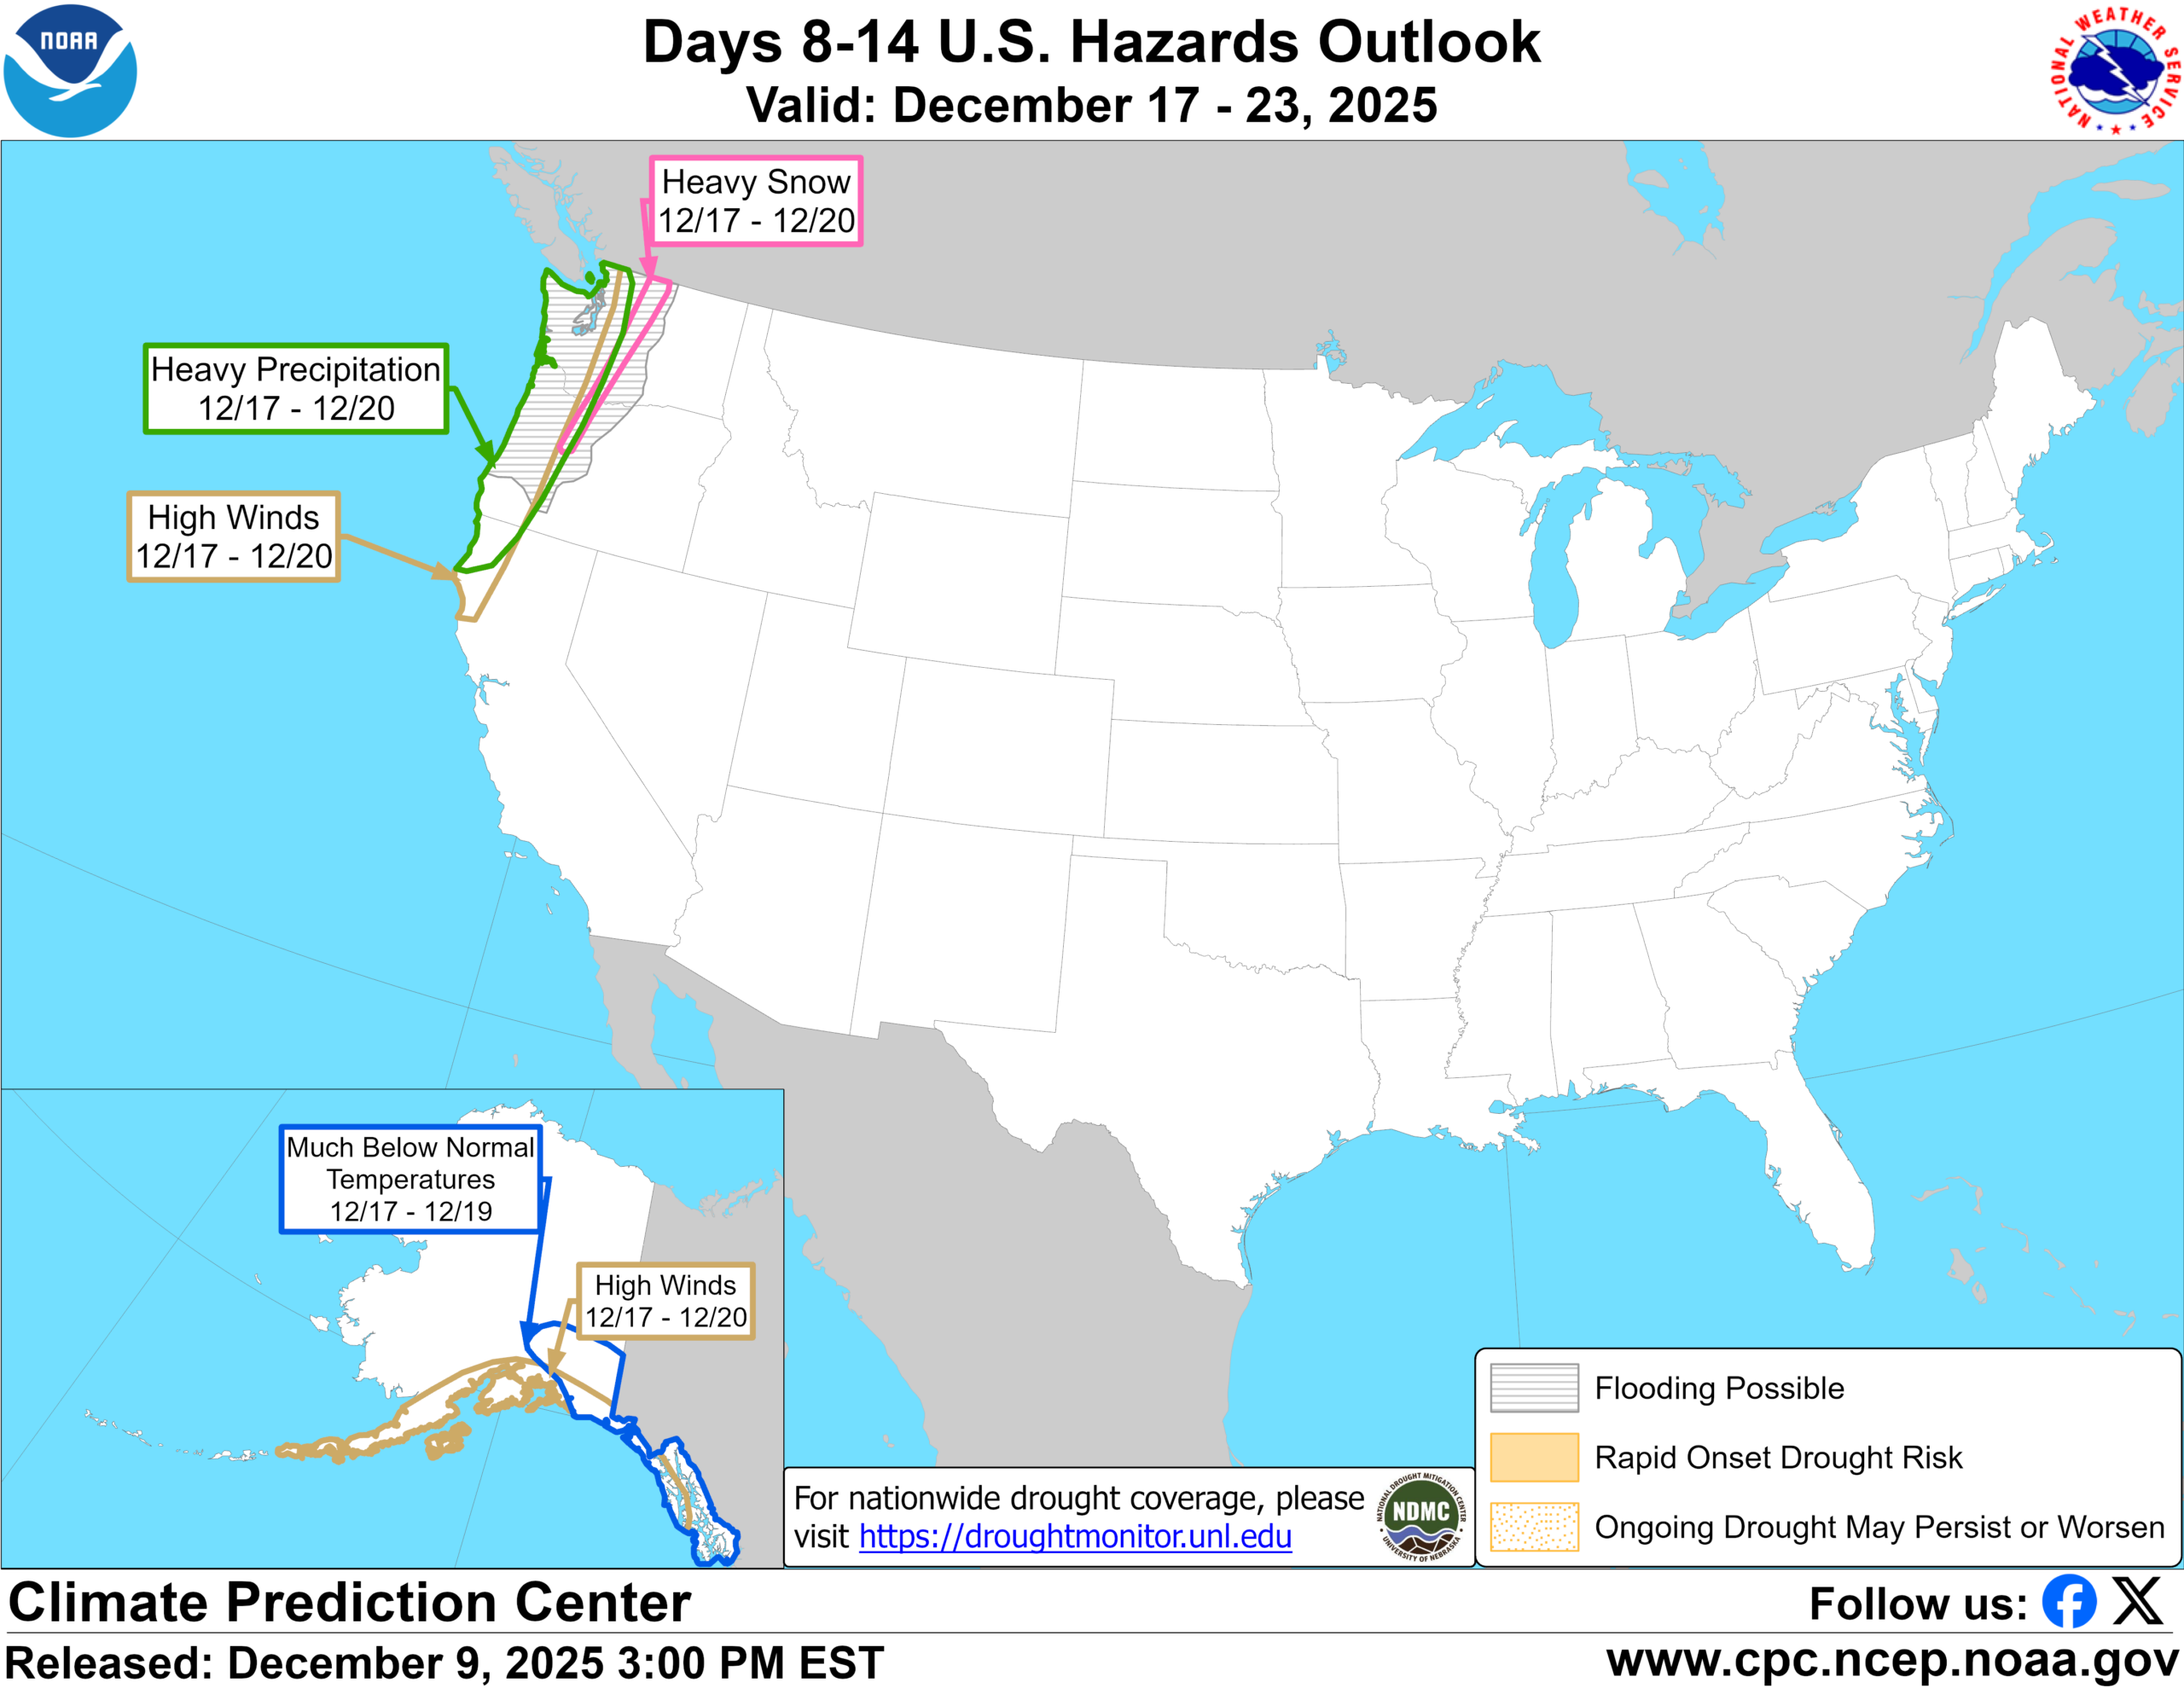
And the 8-to-14-day hazards outlook is once again highlighting the Northwest for potential heavier precipitation after December 16th.
This all shows up in modeling as well, both in traditional and AI ensembles. You can also see it appearing on the atmospheric river graph toward the top of this section. This may be a colder atmospheric river, which would be good news if it actually happens. While moisture is always welcome in the Western U.S., this sort of warmer setup helps only to a point, and it can cause more damage via flooding when it comes as a warm storm. Snowpack is like a savings account for the Northwest. The more snowpack, the more you can draw from your savings account in the warmer, drier months to generate hydropower and supply drinking water. If you just rush all that water through the system now, it becomes problematic and messy. Anyway, I’ll be keeping an eye on the Pacific Northwest in the days ahead.
Newsy Bits
Shaked Alaska
A magnitude 7.0 earthquake struck on Saturday in a seemingly odd place, on the U.S. border with Canada, north of Juneau and east of Anchorage. Kind of a fascinating case study, and thankfully extremely sparsely populated and remote so it likely produced no damage or injuries. What may be fascinating will be how it impacted the Hubbard Glacier, which sits atop the epicenter. I strongly suggest checking out the thorough review of the earthquake, with lots of great detail on the Earthquake Insights Substack (which you should also subscribe to).
Western Pacific AI model struggles
In the Pacific, there had been some buzz about another potentially large typhoon in the Philippines, with Google’s Deep Mind model being particularly aggressive with development. As Alan Gerard pointed out on Sunday, that has not happened. (You should also subscribe to Balanced Weather, as Alan has been covering that side of the globe closely too) Alan notes that he has heard from some in the field that Google’s AI model has struggled a bit in the western Pacific. I echo this as well. This is a fascinating case where the model seems to perform great in one basin but not another. That’s important information as a.) it underscores the limitations of AI modeling today; in other words, we’re not there yet to consider things “solved” and b.) it is helpful context to consider when developing new modeling. Is the solution that we need a new AI model, like GDM tuned to the nuances of the Pacific? Maybe. That’s where AI modeling *could* come in significantly handy; the resources and effort needed to develop a newer model with that consideration in mind would be substantially less and more efficient than if we stuck to traditional physics-based models. There’s work to be done, research to be done, and new tools to be had. Stay tuned.
Closing my browser tabs
FEMA Review Council Recommendations: 6 Questions I’m Hoping to Answer (Andrew Rumbach, Place + Resilience Substack)
Opinion: Do we need another billion-dollar flood before B.C. acts? (Vancouver Sun)
Charleston’s long-simmering sea wall project takes a major step forward (Charleston Post & Courier)
Electricity prices jump after Trump rejects disaster aid for Michigan utilities (Politico)
Chirp one out for the pika: Climate change is destabilizing previously perfect Rocky Mountain habitat (Colorado Sun)
Texas Lawmakers Criticized Kerr Leaders for Rejecting State Flood Money. Other Communities Did the Same (Pro Publica & Texas Tribune)