This post will discuss what happened last week in the Rio Grande Valley, which saw historic rainfall in spots. We will also take a look at a growing risk of serious, possibly dangerous weather in the Midwest and Mid-South later in the upcoming week.
Anatomy of a rainfall forecast partial miss
For some time leading into this past week, there were signs of, not really a pattern change, but a disruption in the stagnant, dry Texas weather pattern we’ve seen much of this year. But it was evident that a significant burst of increased rain chances would impact South Texas at least by later in the week. Indeed, by the time the models got into the high-resolution range, we could see a very strong signal for heavy rain in parts of South Texas. The probability matched mean from NOAA’s HREF model on Tuesday showed 48 hour rainfall totals in excess of 7 inches in portions of the Victoria Crossroads or Brush Country.
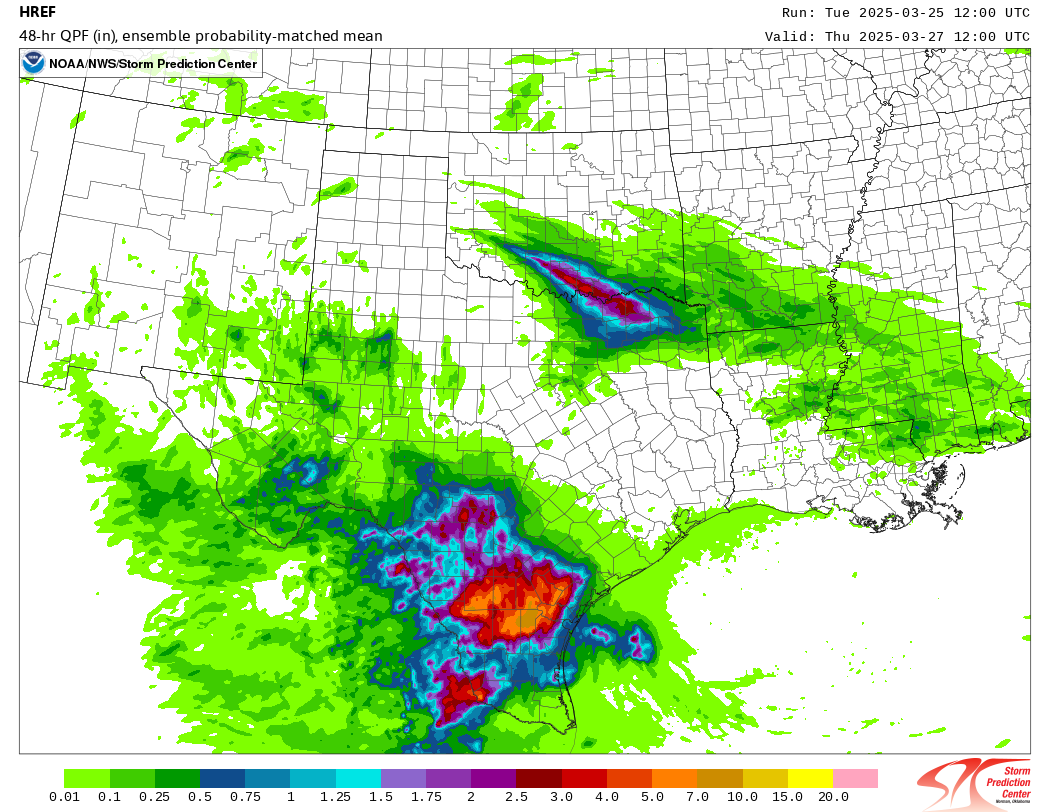
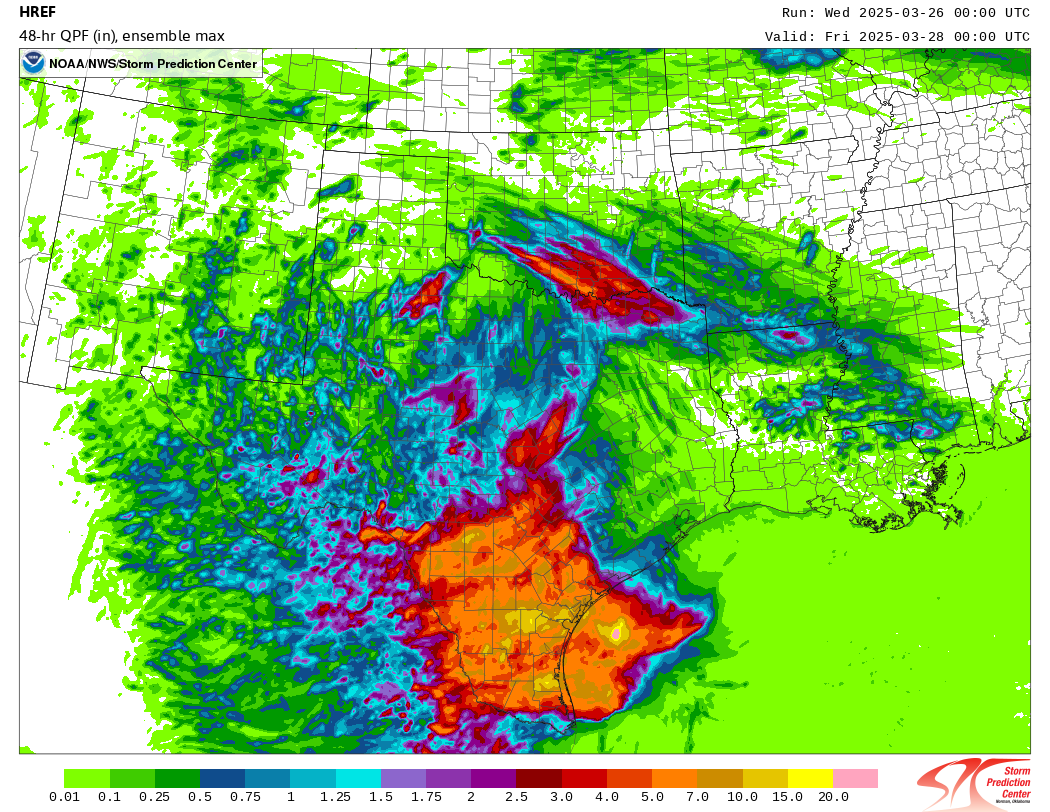
Even when you looked under the hood, this model showed potential for 10 to 15 inches of rain. This was mainly between the McAllen area east to Port Mansfield north to Victoria. By the time we got to Wednesday morning, the HREF model shown above showed potential maximum totals on the order of 5 to 15 inches over a wide swath of South Texas.
This was well captured by the excessive rainfall outlook issued on Thursday morning, showing a moderate risk (level 3 of 4) for South Texas. Previous iterations of this outlook on Wednesday had included the Lower Rio Grande Valley in the outlook but just outside the moderate risk zone. The course correction Thursday morning paid off.
Ahead of the event, as you can even see from the HREF modeling above, there had been a lot of focus of heavier rain totals in interior South Texas and up toward Victoria or closer to Corpus Christi. On Thursday morning, the ICON and GFS models had the bullseye near Matagorda Bay. The European model had it near Corpus. The AI model from Europe (AIFS) had it offshore. It ended up coming in much farther south than any model had.
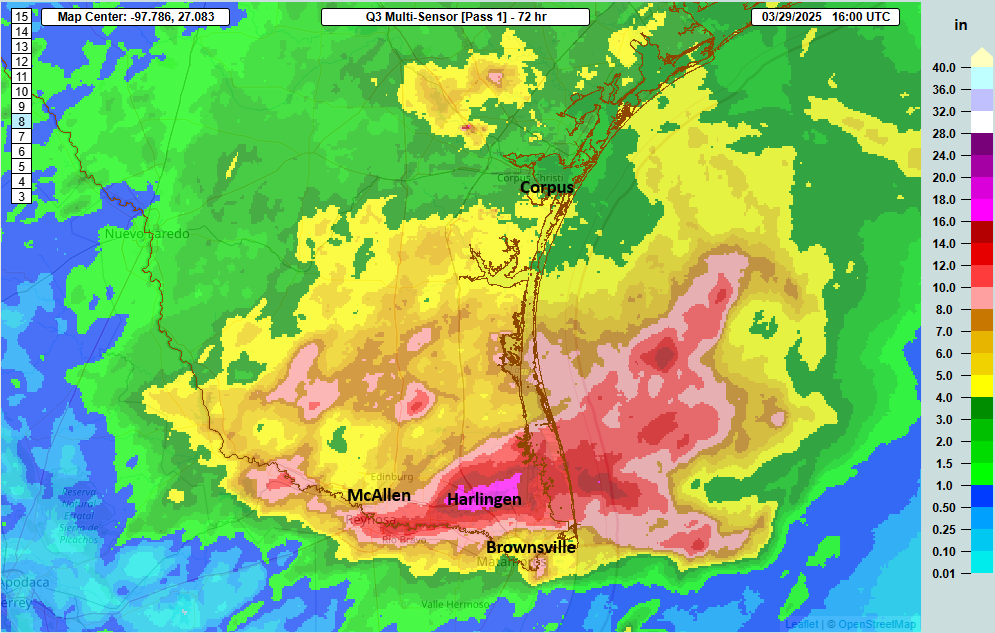
This exposes a major flaw in weather modeling today: Precipitation placement. This issue has been long standing and well known in the meteorology community. When you get major mesoscale driven (smaller, more localized forces at play) weather events like this, models often fail on precipitation placement, even if they offer a significant signal of risk and generalized location. In other words, models alerted us in this case to a strong signal that we’d have some big ticket rain totals in the double digits in South Texas. But whether that was going to occur in Victoria, Corpus Christi, or the Valley was not at all clear. The smart money play was on the area between Corpus and Victoria, much farther north than where the bullseye actually occurred. True, there were definitely areas of 4 to 8 inches of rain in that area, but that much heavier stuff whiffed way to the south.
Indeed, the WPC forecast went that way on Wednesday. Even on Thursday, while the forecast was adjusted to the south, it was focused more offshore. The Flood Watch for the Valley was issued Wednesday evening/Thursday morning just after midnight.
Ultimately, there was some adequate warning, but it would have been nicer to have had some additional lead time. Alas, we do the best we can with the tools we have, and in this case, there had been an indication that someone would get bombarded but not that it would be Harlingen, which smashed their all-time daily rainfall record by 3 inches. Notably, in this top 10 list of wettest days in Harlingen going back to the 1950s, every day occurred between late May and the beginning of October, not March.
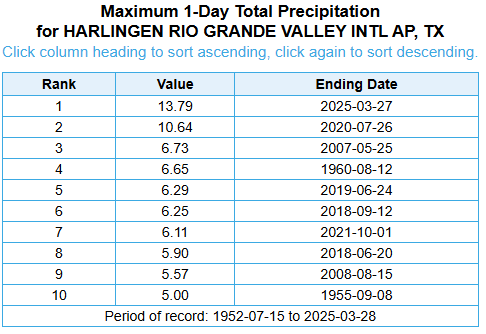
It can rain like crazy in Texas any time of year, but to pull a feat like this off in March makes the rainfall record in Harlingen even more impressive. For McAllen, it was the 3rd wettest day on record, with records back to the 1940s. Unfortunately, many communities saw damage and loss of life from this event. The toll is still being tallied (both in the U.S. and in Reynosa, MX across the border), but it was another in a bad history of Texas floods.
We’ve seen this precipitation hits that also miss during bigger storms like Harvey, Florence, and others. But it’s clear that we need to continue to work on our modeling capabilities with respect to precipitation, as flooding has always been a problem and is getting worse.
More spring flooding risk to come, this time northward
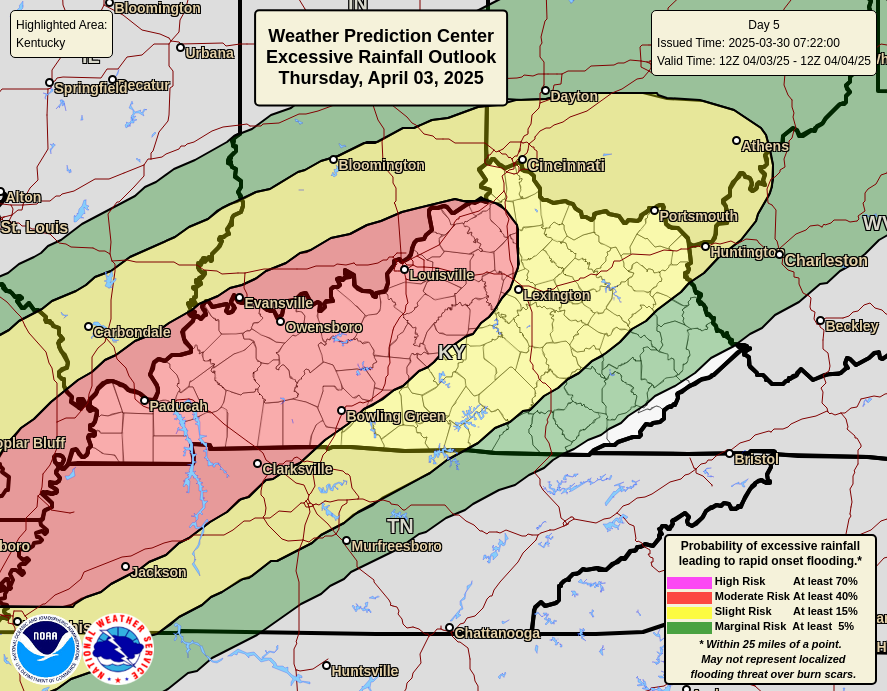
No rest for the weary. Flooding (and severe weather) are going to be hot topics over the next week or more. Today’s severe weather and flooding threat is a little more scattered over a wide area. The next really bad setup hits on Wednesday and Thursday this week. We’ll get to the severe weather outlook in a sec, but first, the rainfall risk. The day 5 excessive rainfall outlook from NOAA’s WPC on Thursday is already at a moderate (3/3) for much of the Ohio Valley.
Here’s a look at a loop of Sunday morning’s European model forecast centered over Kentucky between Wednesday and Sunday, showing several, repeating rounds of thunderstorms across the Ohio Valley and points south. This is a multi-day heavy rainfall events, and the potential totals from this series of storms is significant.
In addition, the severe weather risk on Wednesday is already significant. There seems to be a good deal of model support on Wednesday for developing severe thunderstorms across the Mississippi and Ohio Valleys. Modes look to vary between potential for supercells capable of strong tornadoes and large hail and more “lined out” structure that would carry more of a damaging wind threat. But the signals are all there, leading the Storm Prediction Center to highlight a 30% risk on day 4. I would anticipate this to lead to an enhanced risk to open the bidding tomorrow, with potential for a moderate risk (4/5) before all is said and done.
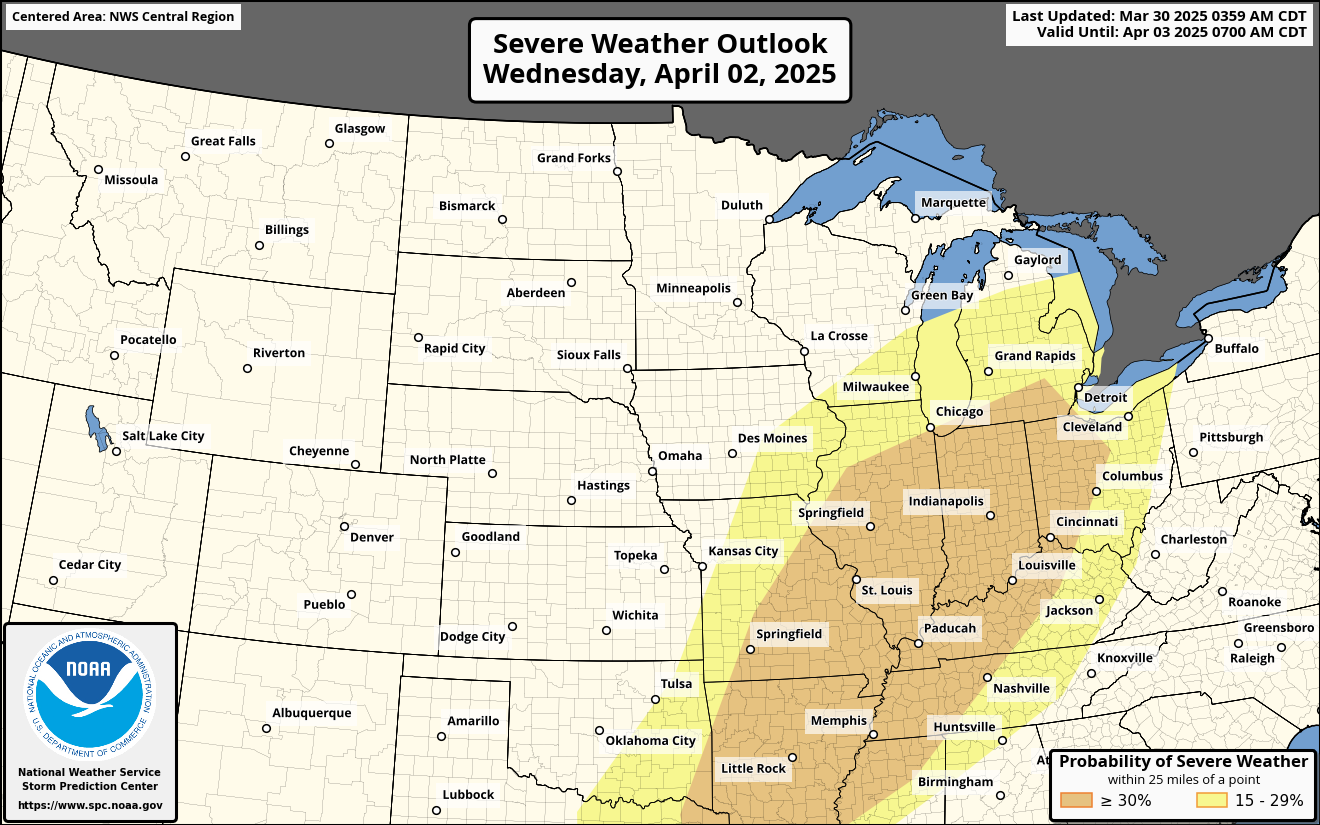
Between the storms and the potential for developing flooding, it appears the Wednesday through weekend period is going to be one of those more enhanced time periods to remain weather aware in parts of the Midwest, Mid-South, and Deep South.
Total rainfall between today’s storms and what we see to close next week may be on the order of 5 to 10 inches.
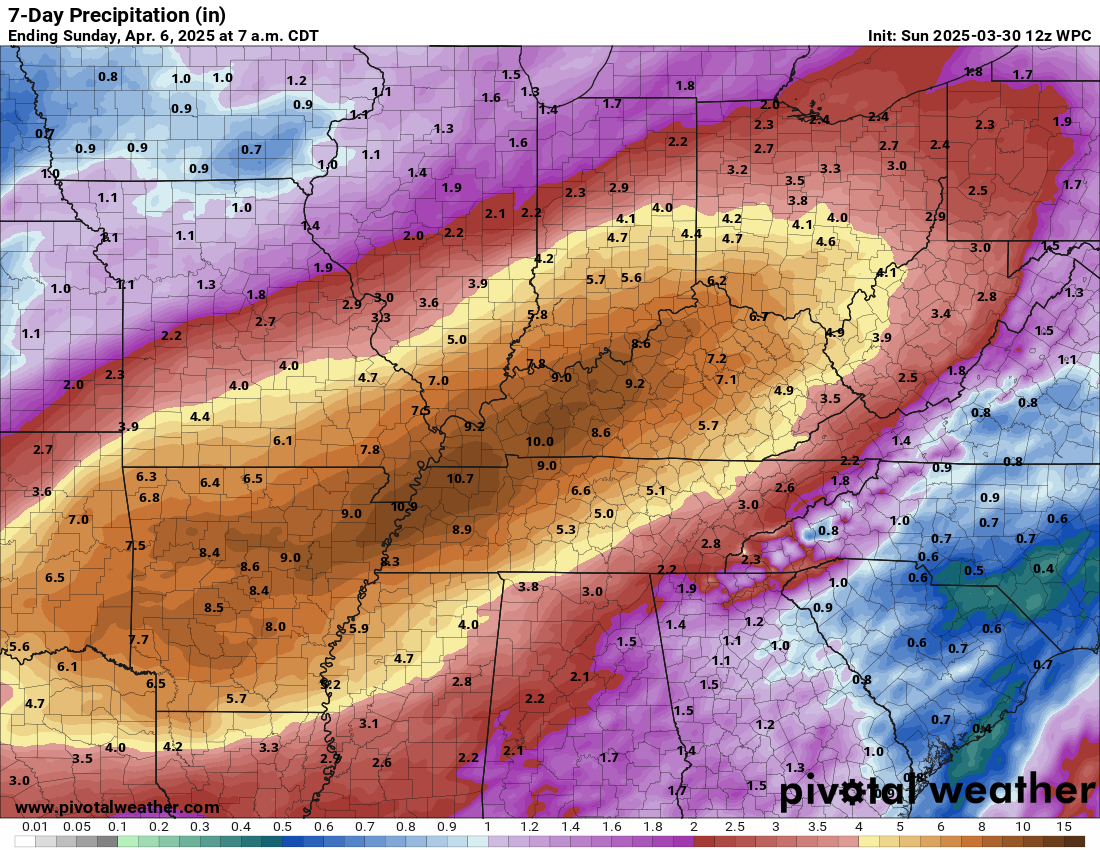
I have to be frank here: Both AI modeling and the traditional ensemble models are in strong agreement on this type of map. Historically, those models tend to underdo rain amounts this far out in this type of setup. So while the expectation is 5 to 10 inches, it seems likely that some places will exceed those values, and those are the areas that could see even more significant, potentially dangerous flooding. This is an event you’ll want to continue to follow closely.
Thanks. I learn something from every newsletter.
The models did not handle this little meso-trof well at all regarding precipitation placement. The day 3 forecast Thursday (for Saturday) showed a weakening system with a marginal risk from Port Allen to SE Louisiana. By midday Saturday WPC had upgraded all the way to Moderate for SE LA, but the rainfall winner was in the Marginal risk area 100+ miles west – Acadia Parish with one CoCoRAHS reporting 10.03″! All the convection fizzled as it moved east of Baton Rouge (which did have ~2-3″ totals). NWS New Orleans did an excellent Facebook post on the reasons for the “bust” on the hotspots, but agree these small scale event have remained frustratingly difficult to resolve.
I presume the European model was developed in Europe. Is there an American model? Is it not as good? Could it not be improved to be better than the European model?
There is! The GFS model is technically the “American” model. It generally suffers a bit relative to the performance of the European model. But it’s a necessary tool as well. There are efforts to improve it, but there are also efforts to improve the model in Europe too, so it’s a bit of an arm’s race to the top (which is a good thing). It’s important to have multiple operational models to compare outcomes to. One model is never enough. That said, depending on how NOAA’s budget is handled, cuts to this work would impact or hamper any progress made to have an improved model here in America.
Ty Matt
⚘