In brief: Today starts with a lot of statistics recapping the blizzard. We then jump into a more nuanced narrative showing how these types of storms unevenly distribute snowfall. After, model performance in the 1-2 days ahead of the storm is assessed, and the results are fascinating.
Blizzard recap
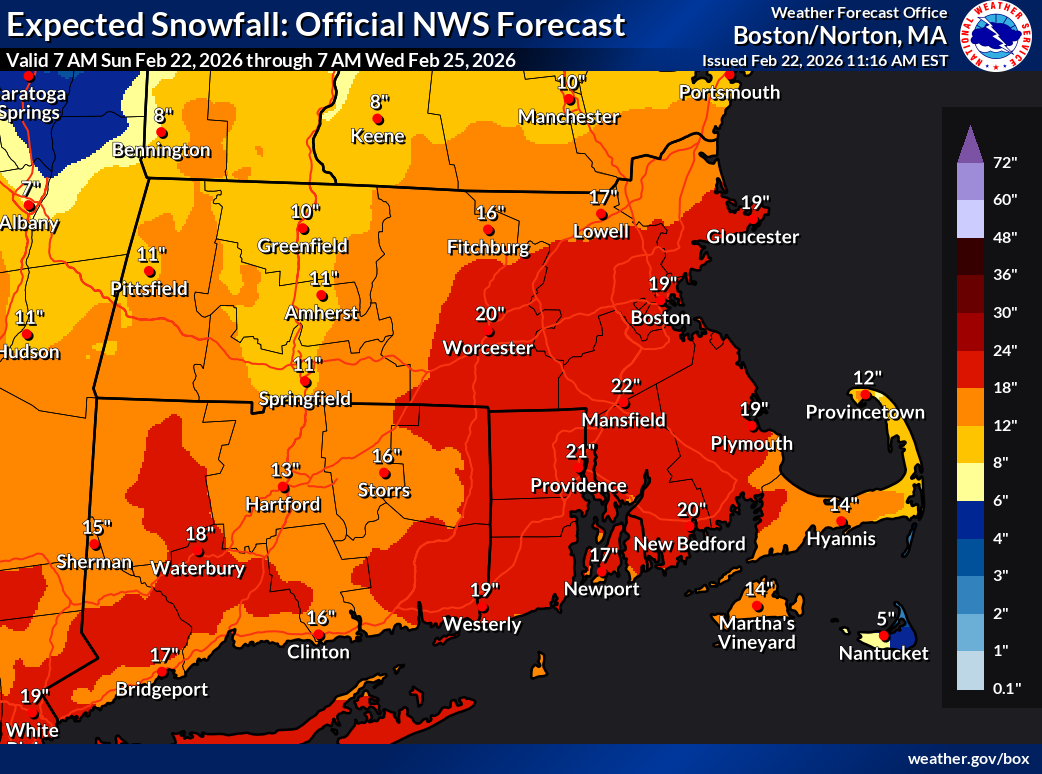
The blizzard that raked the Northeast and parts of the Mid-Atlantic will go into the history books as a first-ballot hall of fame storm. For southeastern New England, this storm rewrote the records. Prior to yesterday, Providence, Rhode Island’s biggest snowstorm came in the Blizzard of ’78 (which if you recall we mentioned before this storm). In that one, they received 28.6 inches of snow. Going forward, the bar has been raised 9 inches higher. Providence finished with 37.9 inches of snow yesterday, a single day and storm record going back into the early 1900s. Incredible. They weren’t alone.
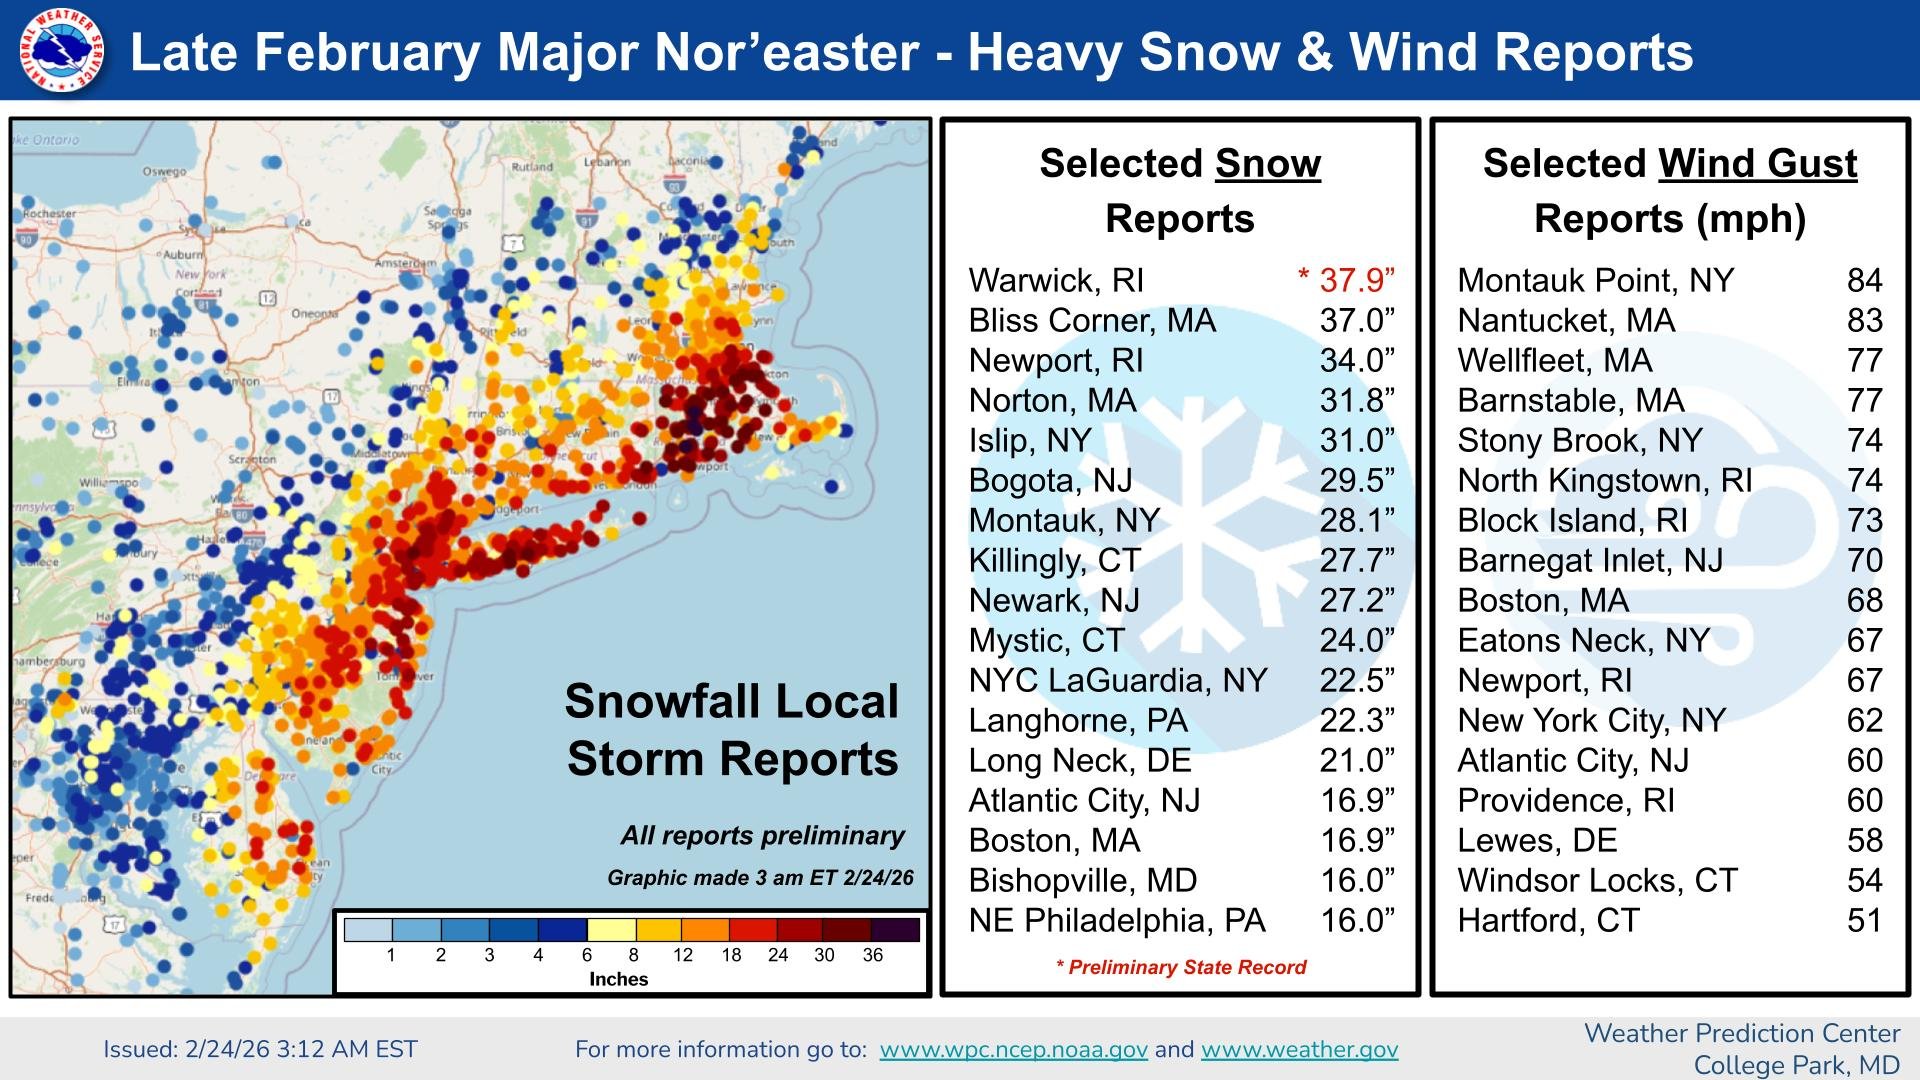
The 37.9 inch total in Warwick (TF Green Airport, Providence’s official obs site) is a preliminary state record for Rhode Island. The current record is 30 inches in Woonsocket from the Blizzard of ’78. Before a state record is certified, it needs to undergo a pretty rigorous investigation on how measurements were obtained, quality of siting, quality of measurement, timing, location, etc. The last certified state record snowfall occurred in 2013 in Connecticut, when Ansonia had 36 inches. A more recent candidate from Milton, Florida’s 9.8″ in January 2025 has not yet been certified to my knowledge.
I figure it’s as good a time as any to take a second and look at the all-time record snowfalls in the Northeast Corridor.
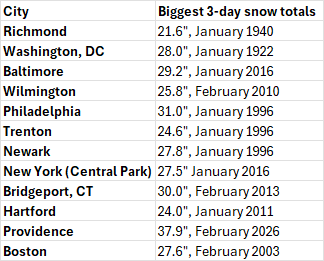
Richmond’s record has been established since 1940. Washington’s biggest storm remains the Knickerbocker Storm of 1922. Baltimore established their record in 2016’s “Snowzilla” storm. Wilmington, DE set their record in 2010’s Snowmageddon. Philly through Newark remains Blizzard of ’96 territory. Central Park also set their record in 2016. Bridgeport, CT won their record in the 2013 storm The Weather Channel dubbed “Nemo.” Hartford’s record was established in January 2011. Providence has a new benchmark, and Boston set theirs in Presidents’ Day II in 2003. Interestingly, every major city north of DC had their record established in the last 30 years (one notable exception is Albany, which is still led by the Blizzard of ’88…1888).
Snow disparities and model performance
We often think about nor’easters and East Coast storms as monoliths. The big storms were the Blizzard of ’96, the Presidents’ Day blizzard of ’78, Snowmageddon, the March 1993 Superstorm, etc. But as our technology has improved to be able to analyze these systems, we’ve learned so much more about how complicated they are. We’ve always known storm track was important; that much is obvious. But in the last 20 years, we’ve really latched on to understanding how banding and gradients, these finer-scale features within nor’easters can really amplify snow totals in some spots. You can see that in this storm too.
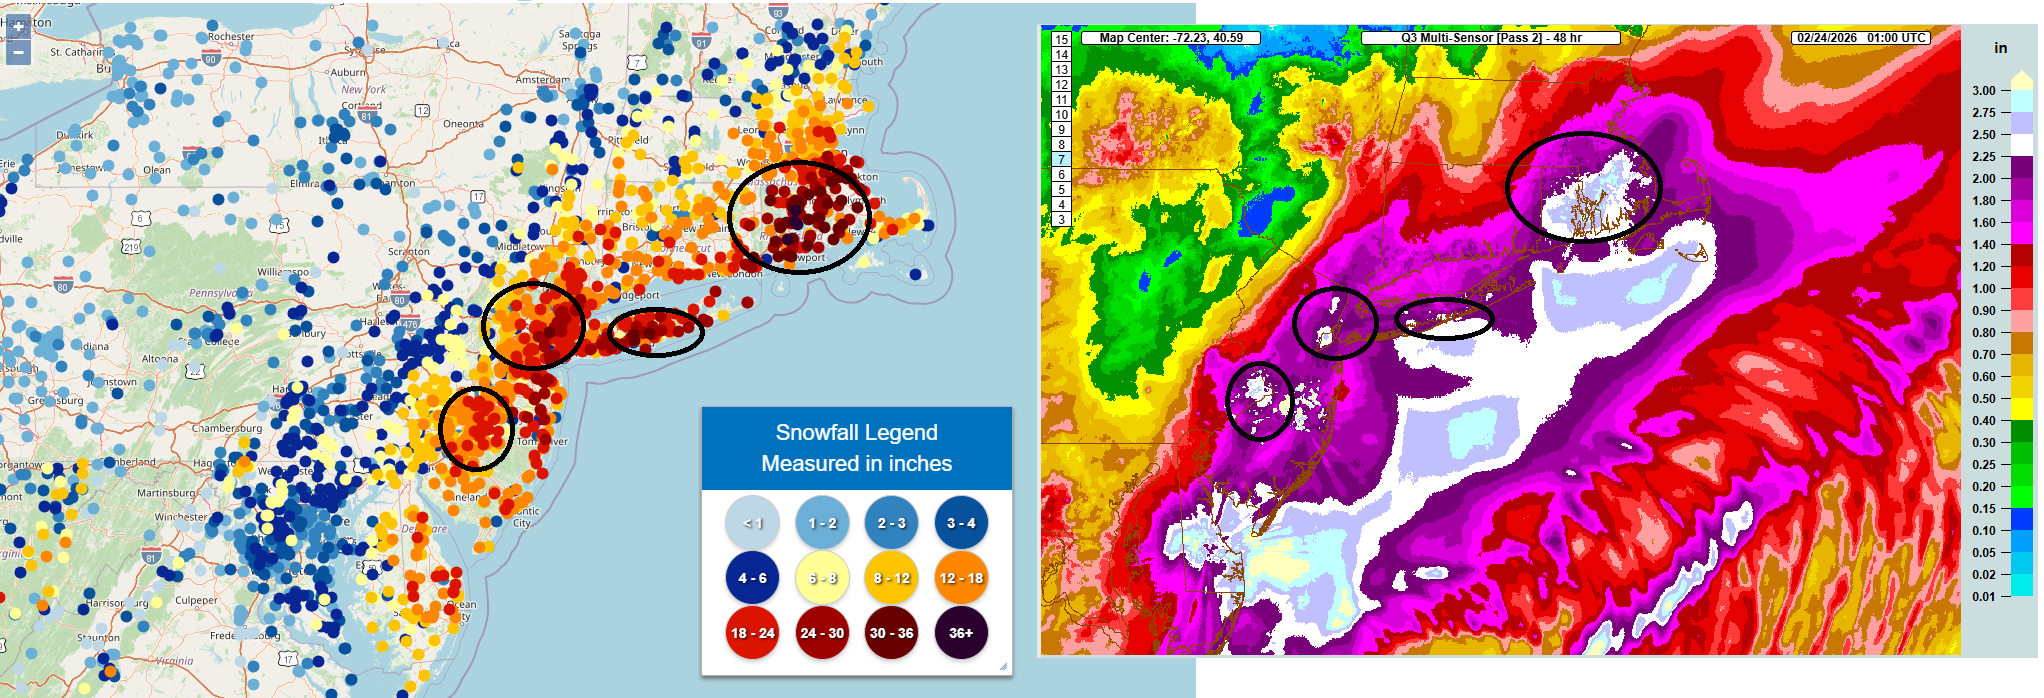
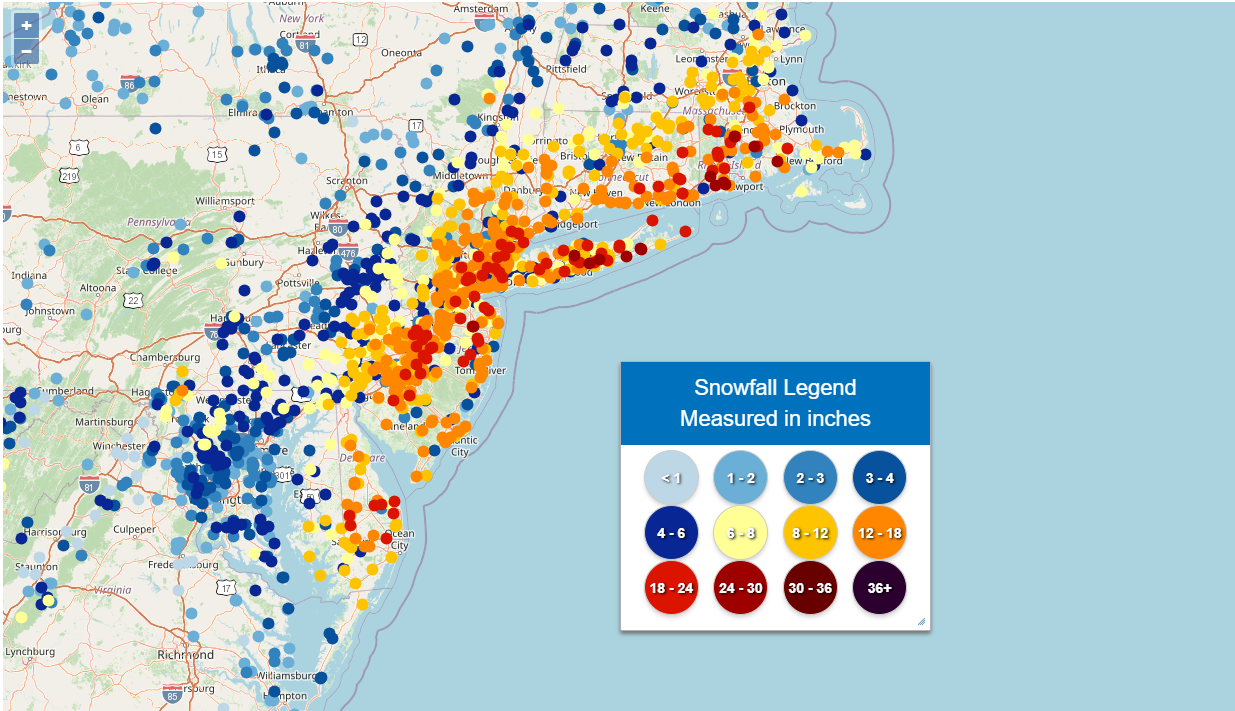
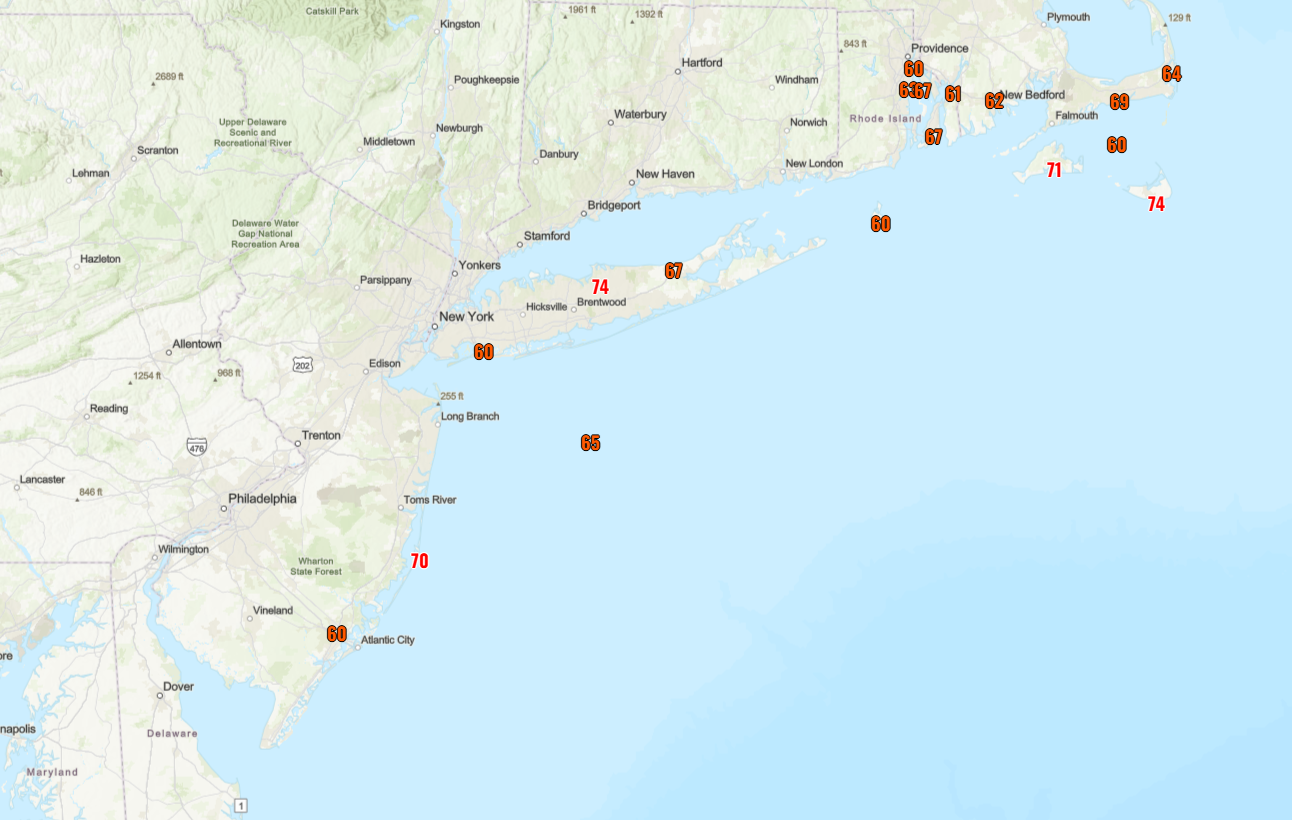
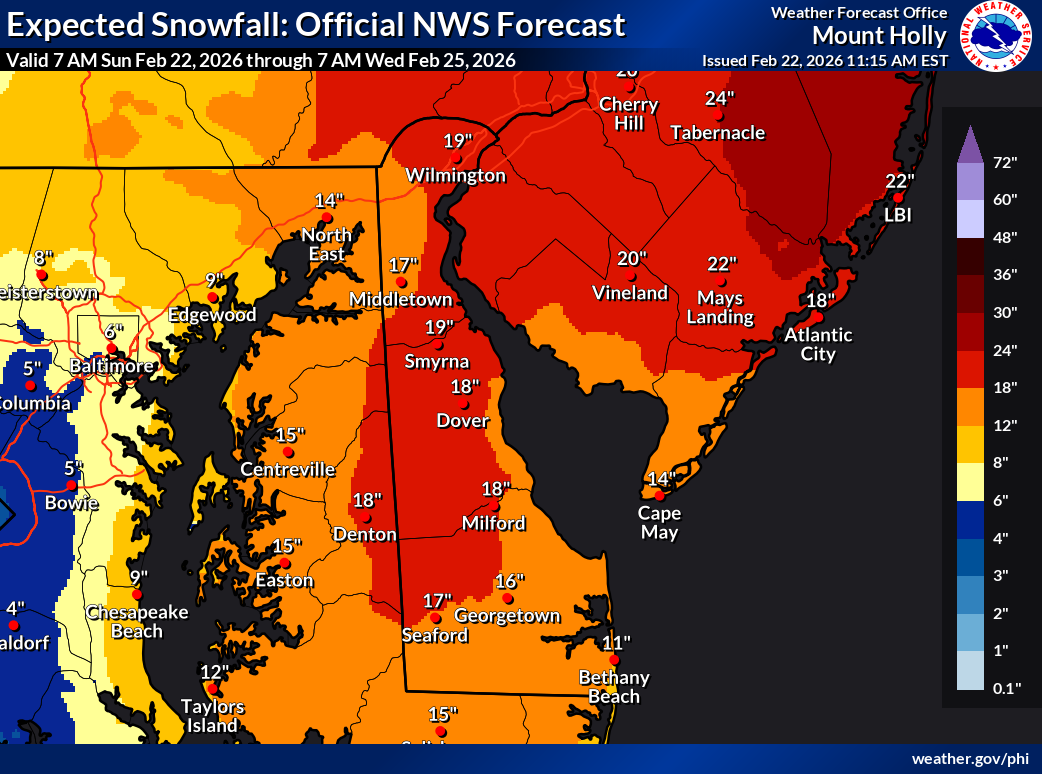
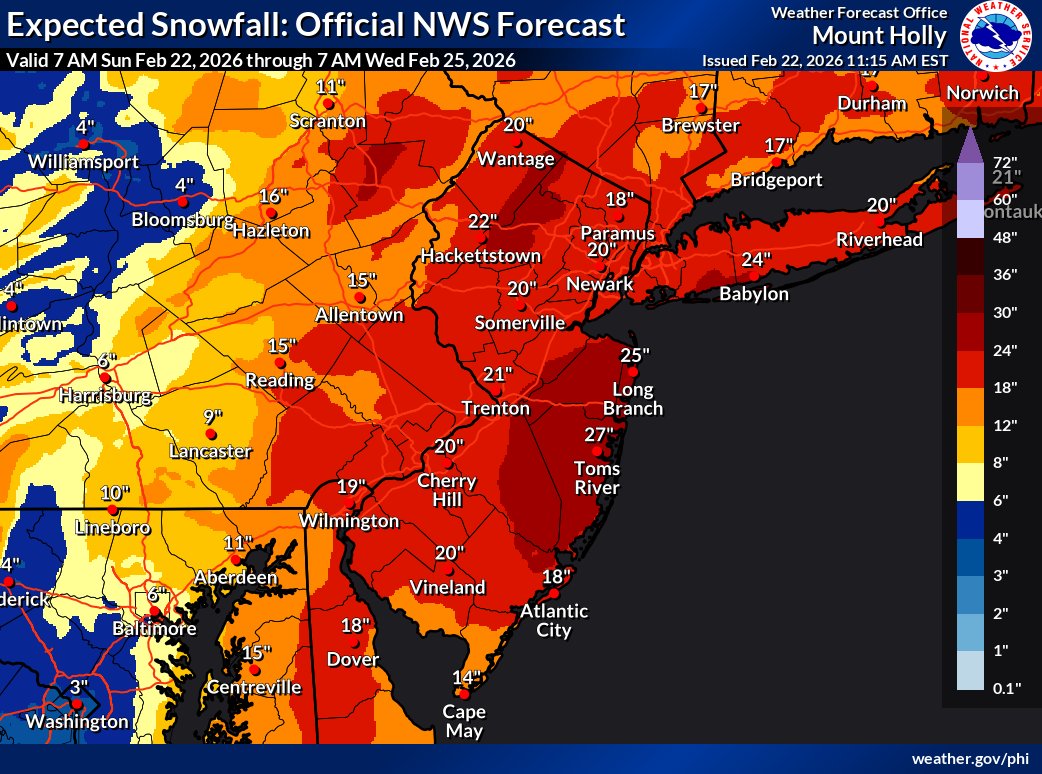
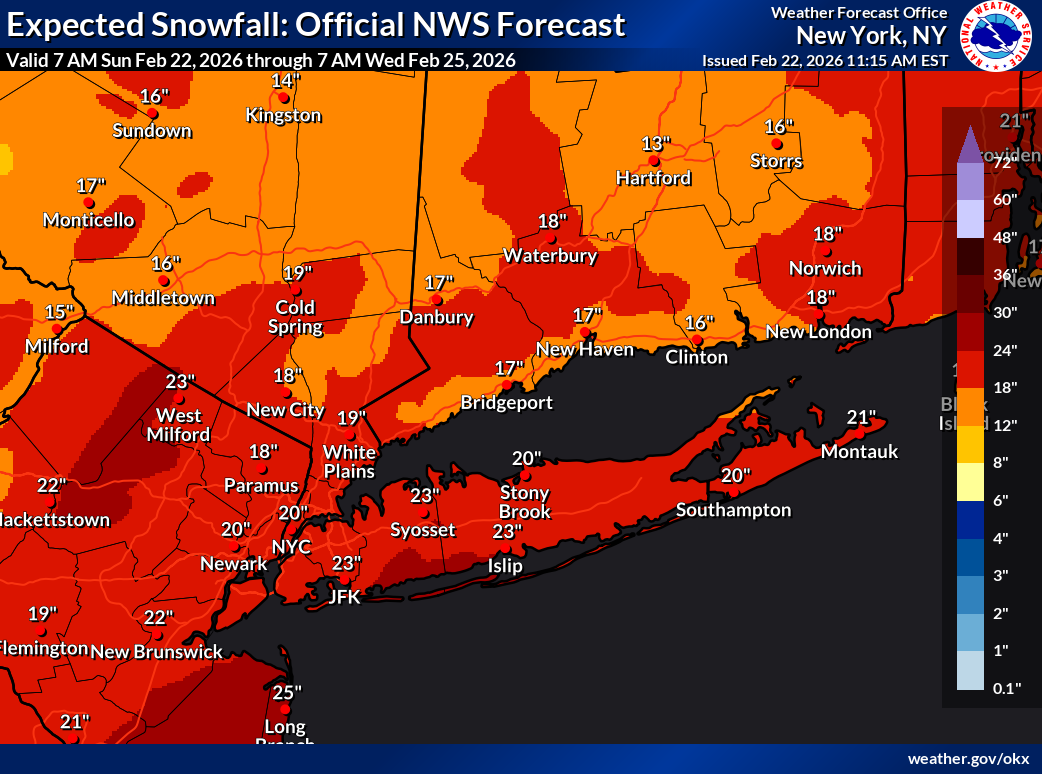
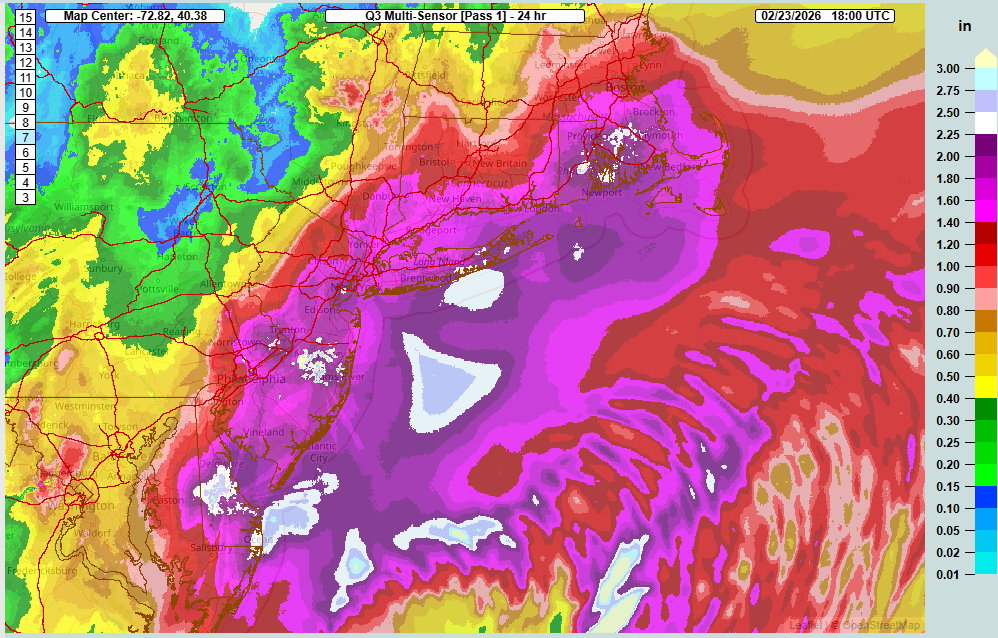
In the maps above, which you can enlarge by clicking on the image, I compared a few areas of relatively higher snow totals compared to areas around them. That’s the map on the left. It’s imperfect because reports are not evenly or equitably distributed or entirely finalized, but there is enough there to give you the general picture. To the right is the radar estimated precipitation. I narrowed the scale to exaggerate the differences and to try and tease out some relatively higher values. If you look at the overlap between the higher totals we saw in southeast New England, Long Island, the NYC Metro, and between Trenton and Philly, those do correspond to higher radar estimates as well. The location and “noise” from the Doppler sites makes this a little more challenging, but there’s enough “there” there. Those areas were more likely to trip 2.25 inches of radar estimates than in other areas. Delaware could also be included here I think as well, and the radar totals there are much higher due to warmer temps and some mixing.
So within the storm, these mesoscale banding features establish and sometimes pivot, and you get these corridors of amplified snow totals, not a monolithic slew of snowfall. You can see that in 1996 as well, though with somewhat less clarity than you can see today.
You can see the terrain effects in Maryland and the Virginias, as well as where the “megaband” setup along the Northeast Corridor between Philly and Morristown.
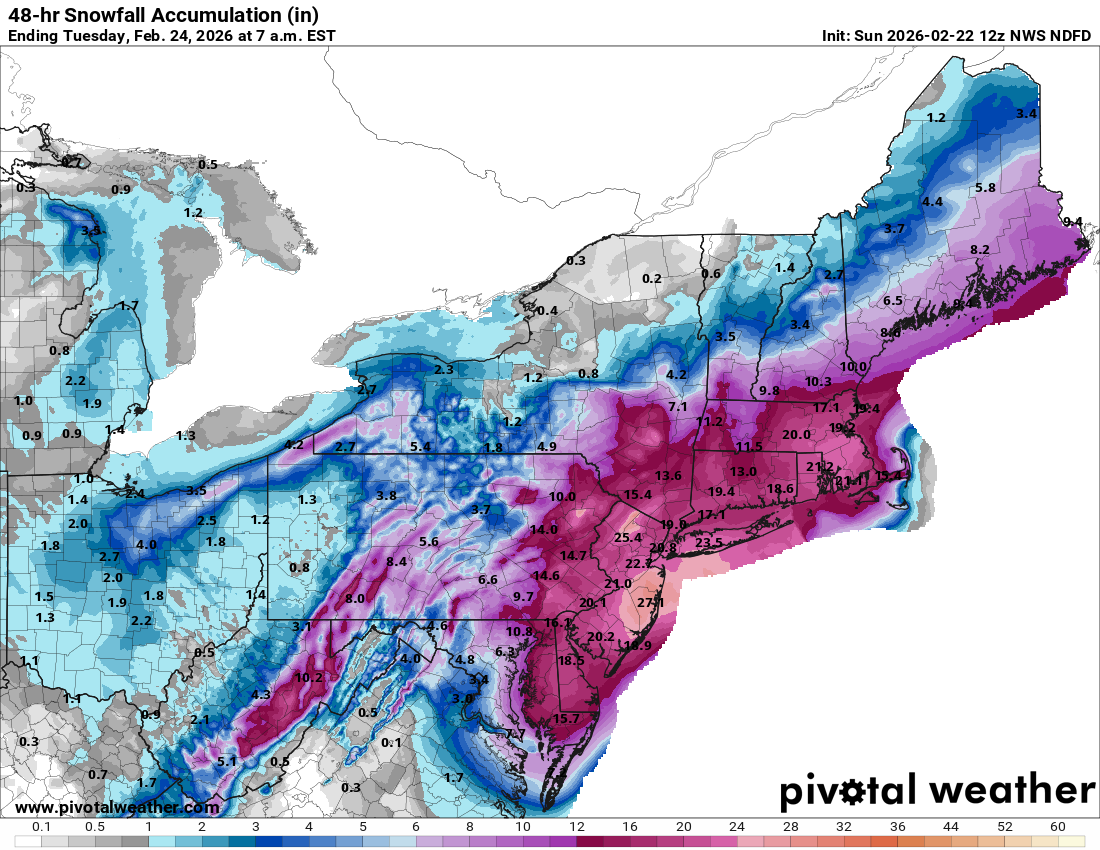
So with all this nuance, how did the models perform this go around? It’s tough to say who “won” per se, but clearly this was a general GFS victory, as it sniffed it out and kept it held even as the Euro got wishy washy. But, let’s focus on precipitation totals. Here were the global model forecasts from Friday morning’s model runs.
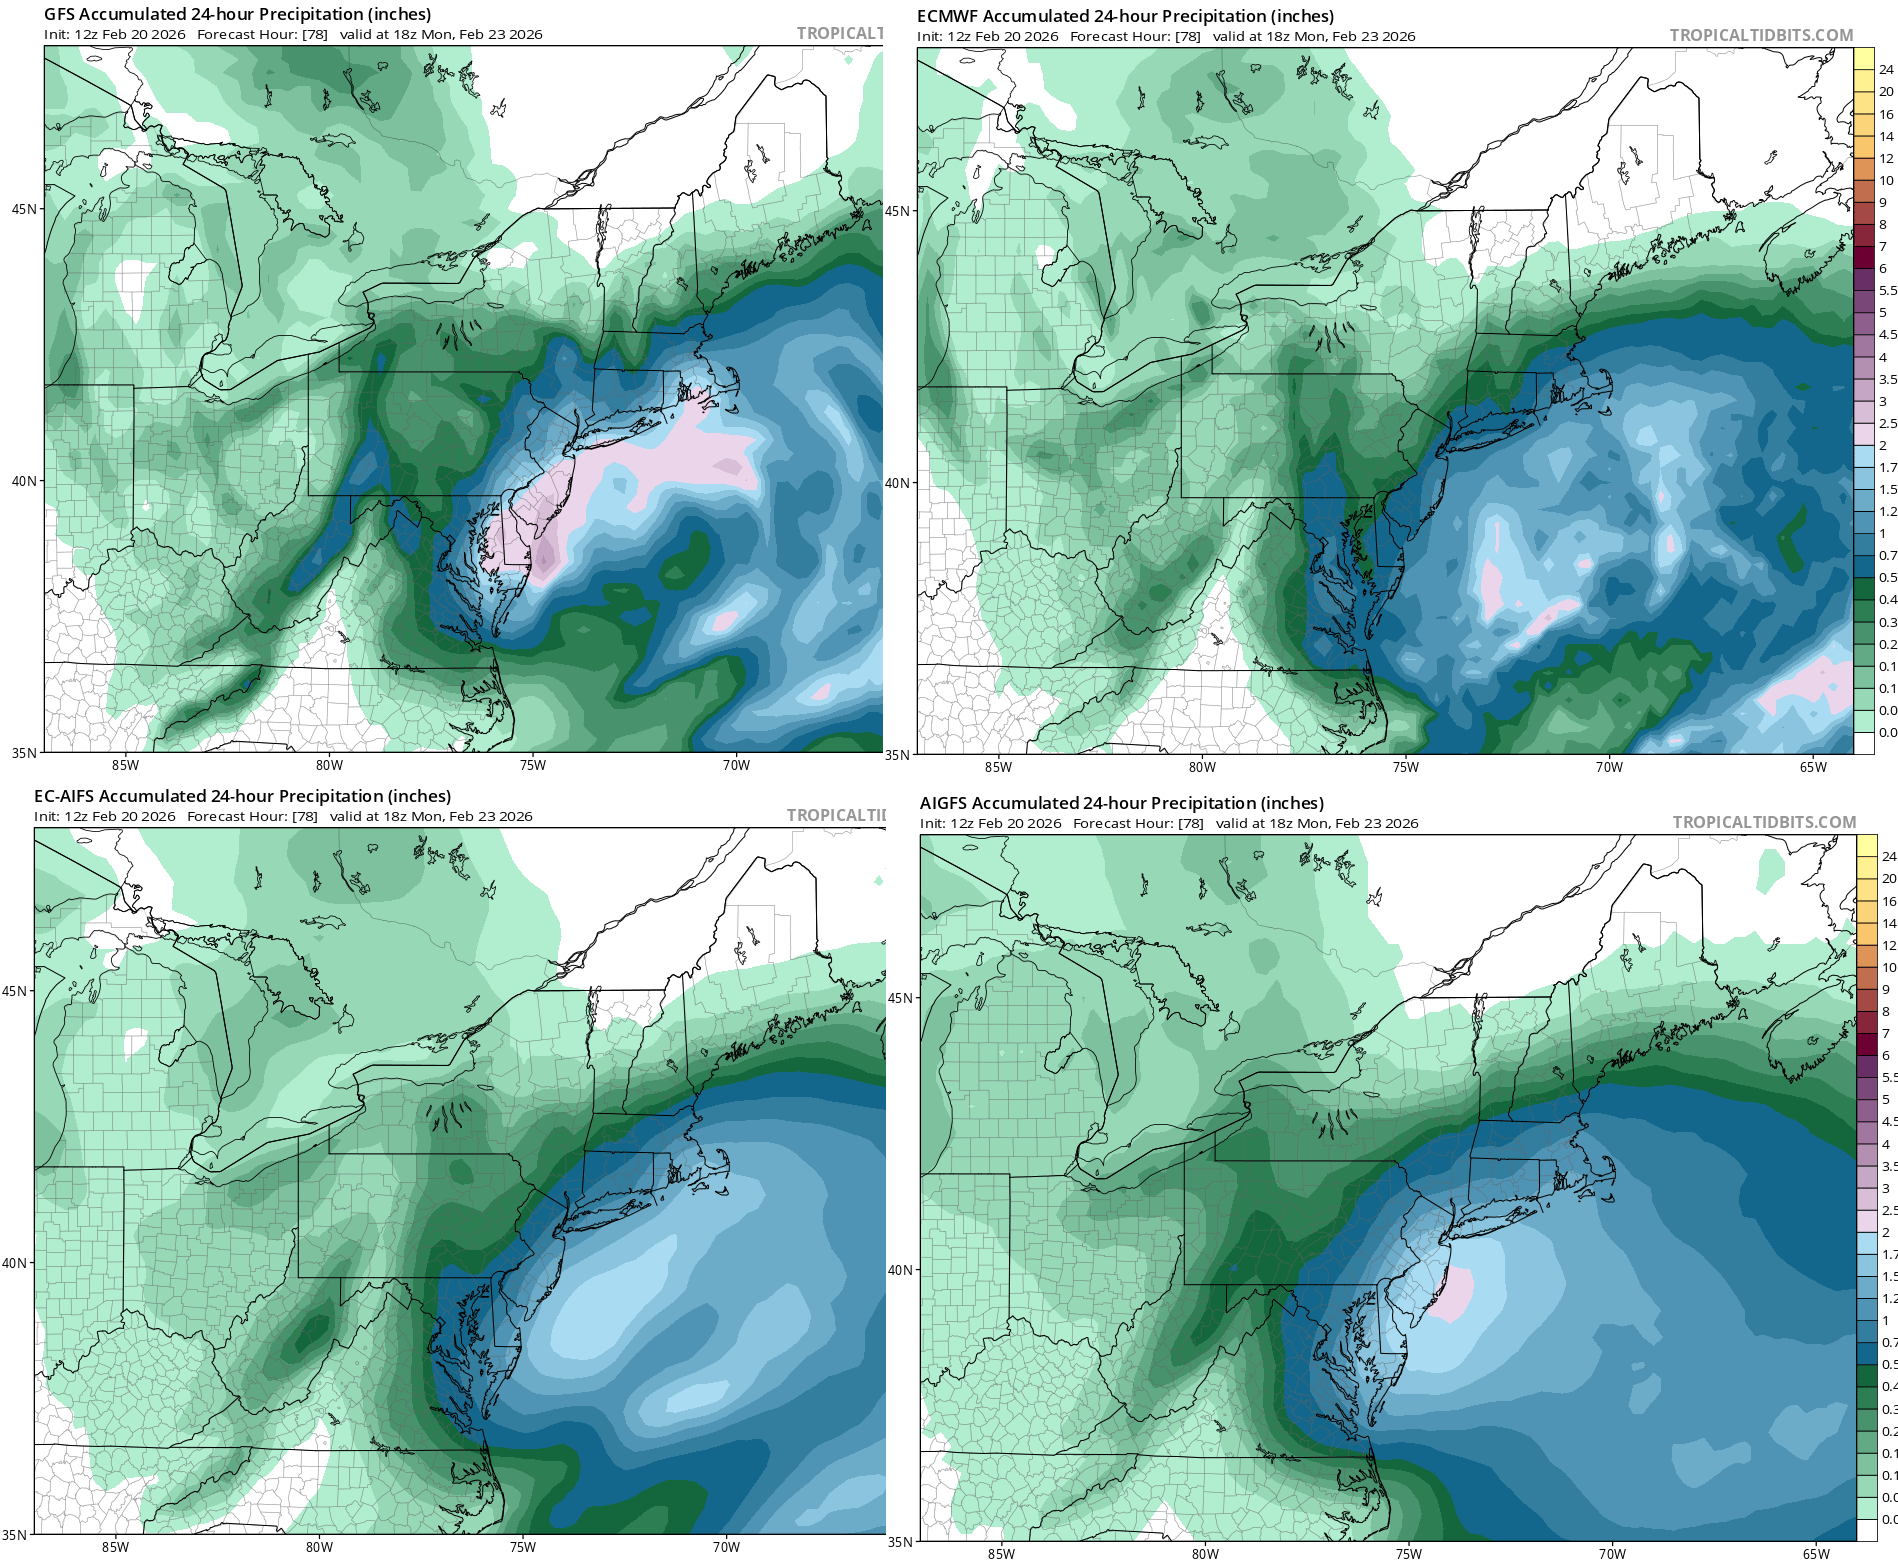
I had to take 24 hour precipitation in this case because there was consequential precipitation Friday that would have polluted this map. But you can see that the GFS, although somewhat overdone in terms of total liquid did correctly pick up on the relatively higher totals we saw in Delaware, Long Island, and southeast New England. The Euro was much too dry. Their AI counterparts did similarly, though in the Euro’s case, it looks like the AI model somewhat outperformed the physics-based model. Again, here was the total precip in that same 18z-18z 24-hour period.
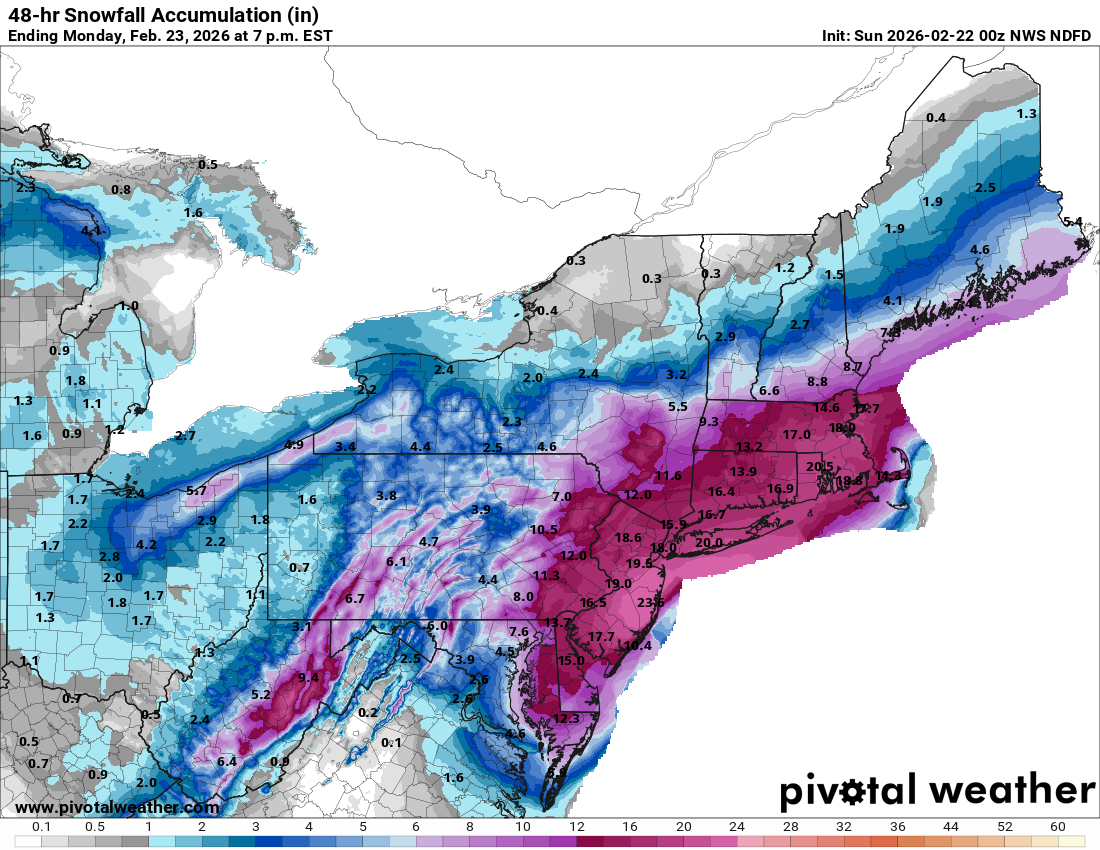
If we look at how some of the shorter-range models (NAM, HRRR) did on Saturday morning/afternoon, as well as the Euro, in a time you’d expect to have the storm nailed down, we see some interesting things.
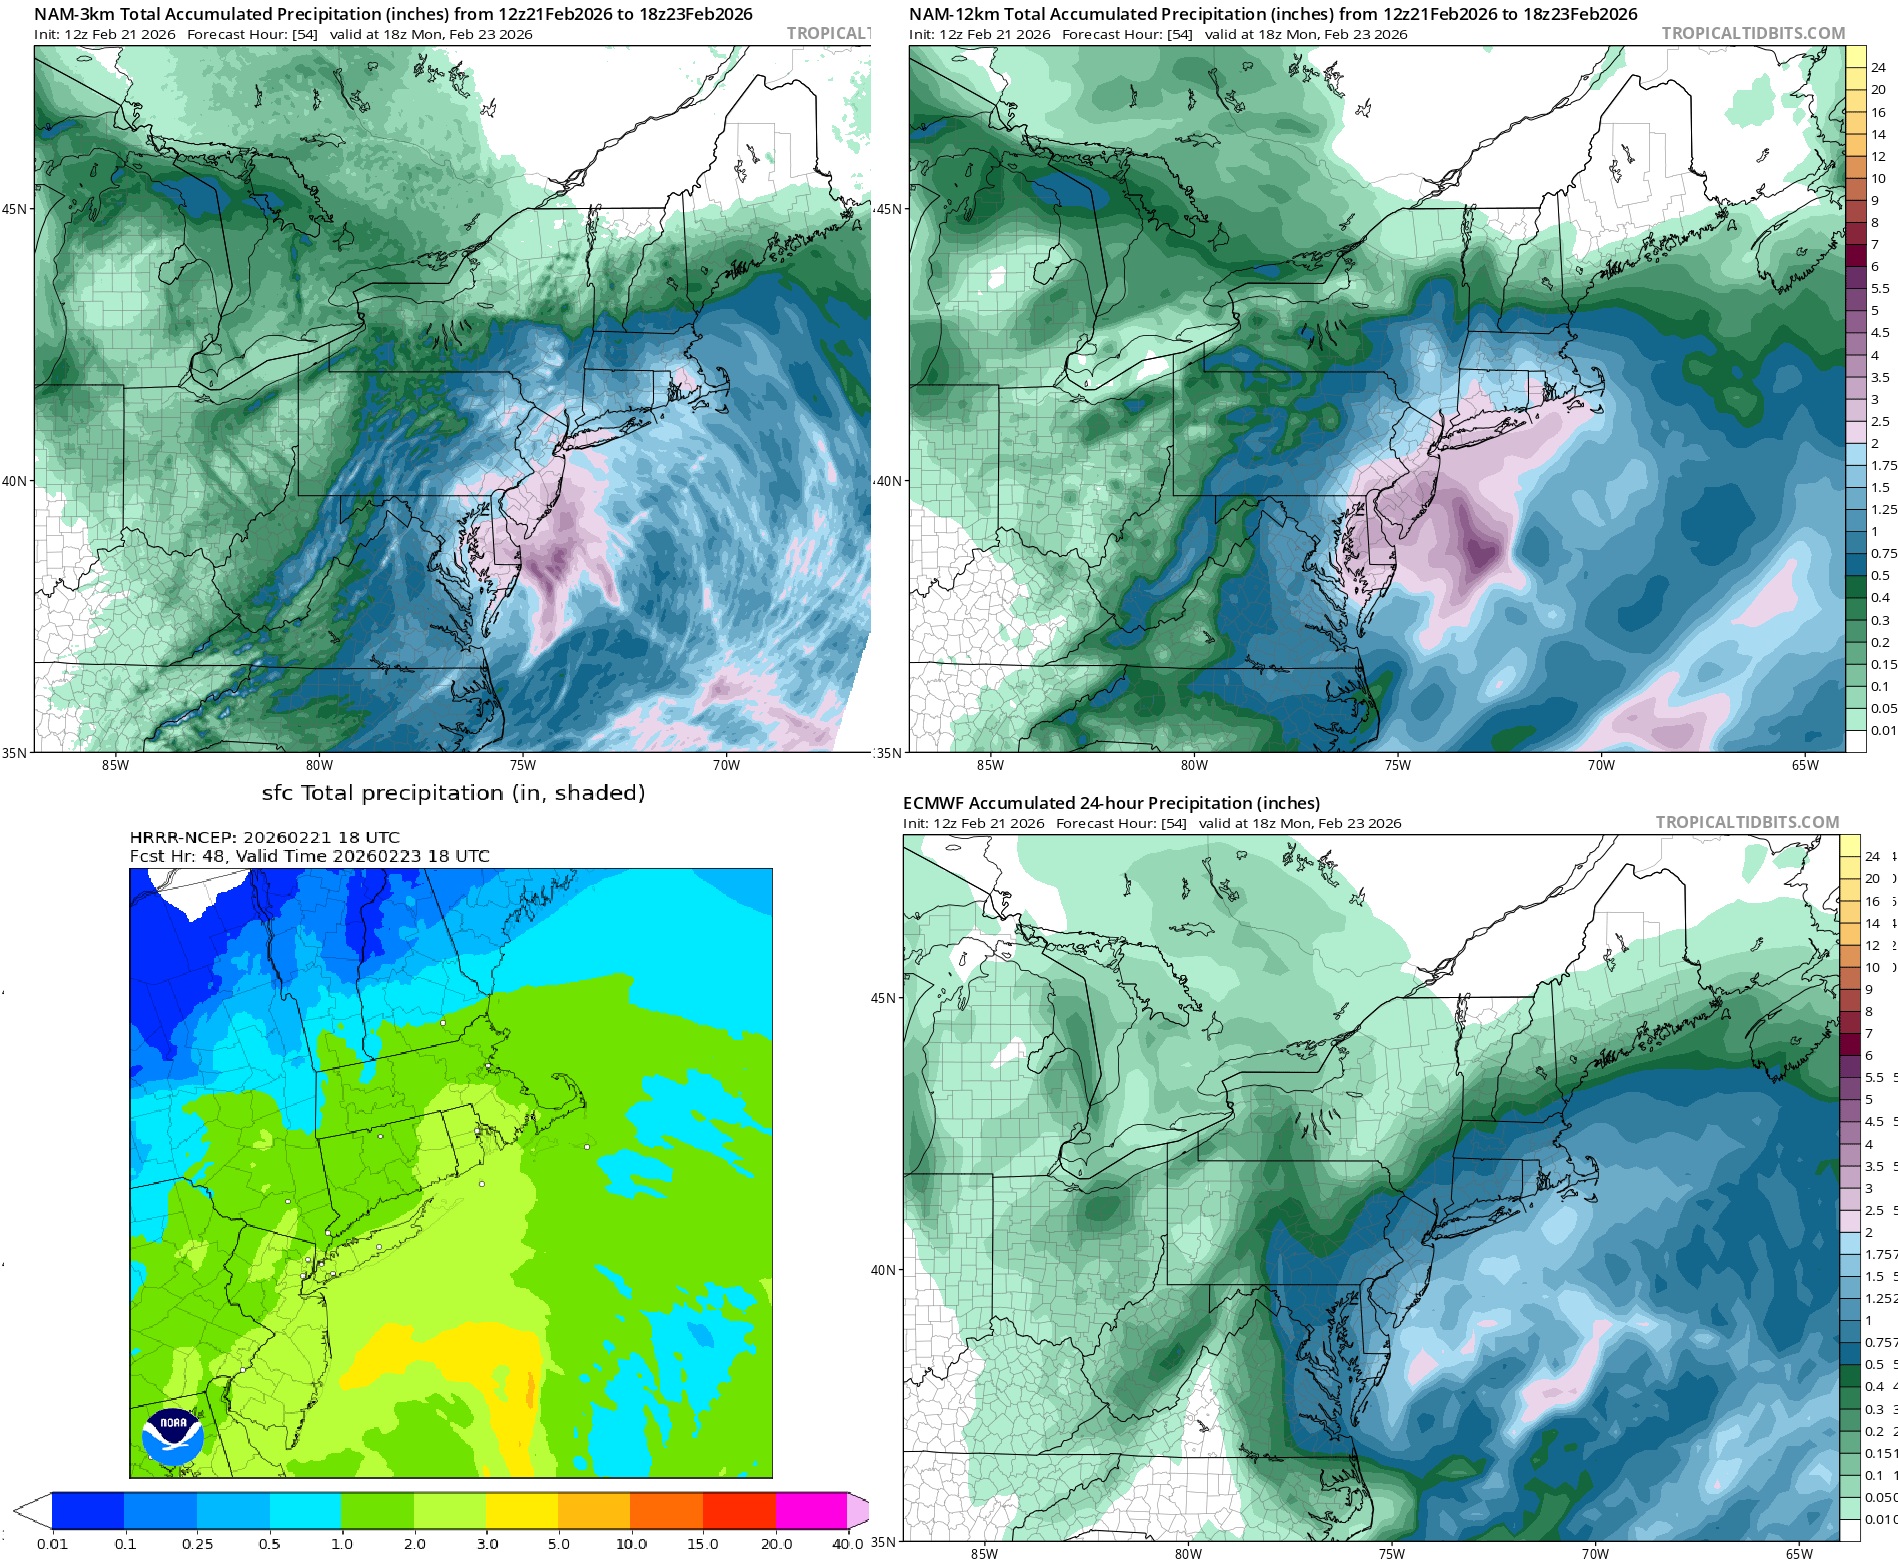
24 hour precipitation from 18z Sunday through 18z Monday for (clockwise from top left) the hi-res NAM, classic NAM, Euro operational, and HRRR. (Tropical Tidbits, NOAA)
First, I had to struggle to find an adequate HRRR image, so I settled on the one from NOAA. Secondly, let’s assess this. The NAM’s hi-res 3km version? Not terrible. It highlighted southeast New England, Long Island, and the heavier stuff near Delaware. The classic NAM? A little overdone in Jersey. Recall, we saw the peak totals showing up ahead of the storm in Ocean and Monmouth Counties in NJ. In reality, those locations did about as well as the whole corridor from there into New York City and Long Island. But overall, it did okay. The HRRR is a little tougher to lean into with poor granularity, but generally speaking it handled itself ok, though it slightly overdid the 2-inch totals. It nicely highlights Rhode Island relative to the rest of New England though. And the Euro continued to struggle here.
It will be interesting to see why the Euro floundered with this event so much more than some other modeling. Even with a 6-hour lead time on Sunday it still dropped the ball on precip totals and was outdone by the GFS in most cases and even by its own AIFS model. On that last point, it is encouraging to see the AI modeling handle a storm like this fairly well.
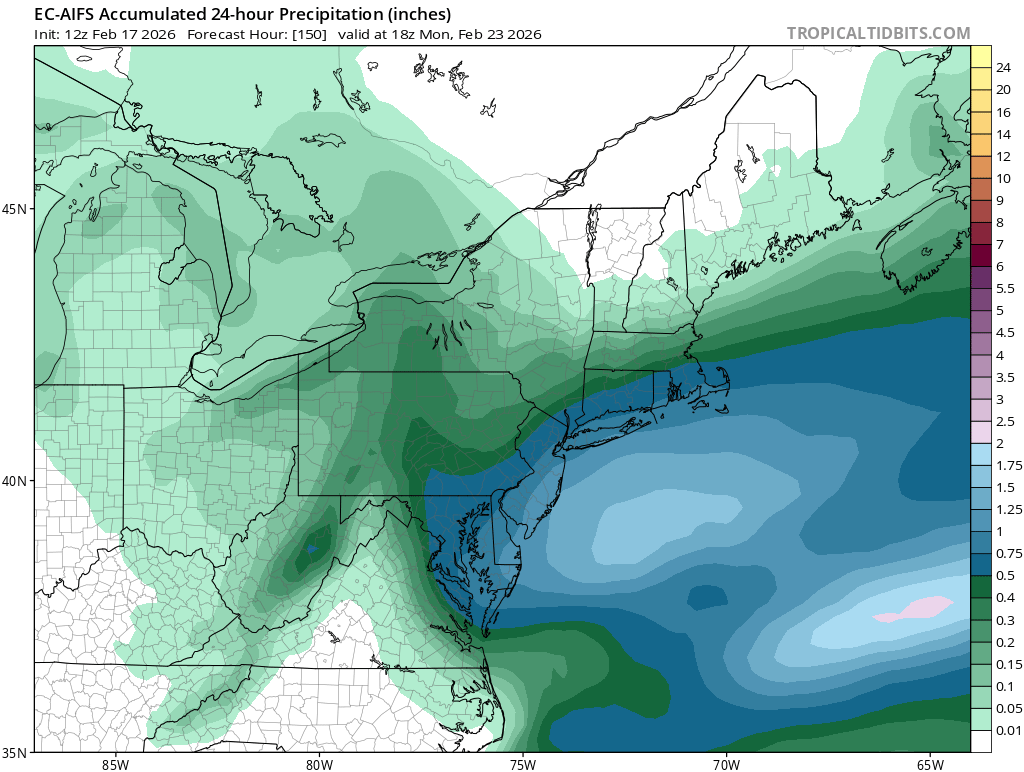
You can see that the signal was quite robust on the AIFS with that Tuesday morning run. Now, to be fair, it did lose it that night and did not really fully recover til Friday, though it showed correct trends in the runs between. Still, it stabilized faster than the Euro operational. I’m not going to call this one a “win” for AI modeling, but it was an encouraging overall performance that shows where it has strengths and value when used in conjunction with other model output, even at short lead times. Had you noticed this, noticed the Euro wavering, and noticed the consistency in the NAM modeling, any questions of uncertainty would have been allayed somewhat on Saturday. Easier said than done however, and Northeast snowstorms remain one of forecast meteorology’s most difficult challenges.