In brief: We have the latest on the impacts of the coastal storm on the East Coast that will be the worst since at least January 2016 or even Hurricane Sandy for South Jersey and Delaware it appears. Impacts will be significant and wide reaching. Meanwhile, heavy rains will unfold across the Southwest today, leading to flooding concerns. Jerry moves out to sea now, and Karen forms almost off the map.
Coastal storm
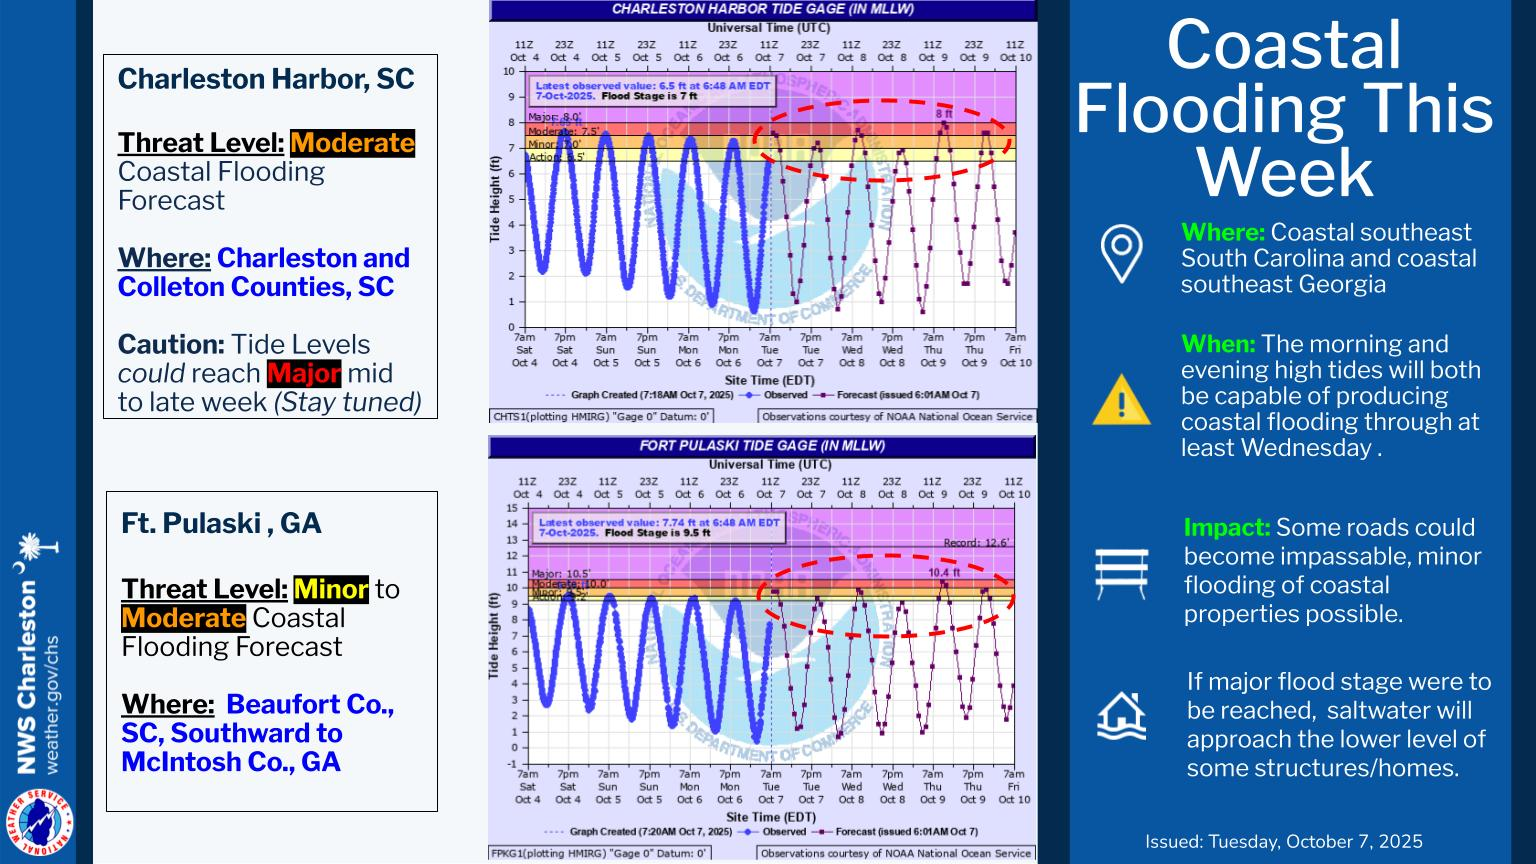
We are beginning to see our drawn out coastal storm begin to take shape off the Southeast coast. Moderate tidal flooding is expected in Savannah this morning, and major tidal flooding is expected in Charleston.
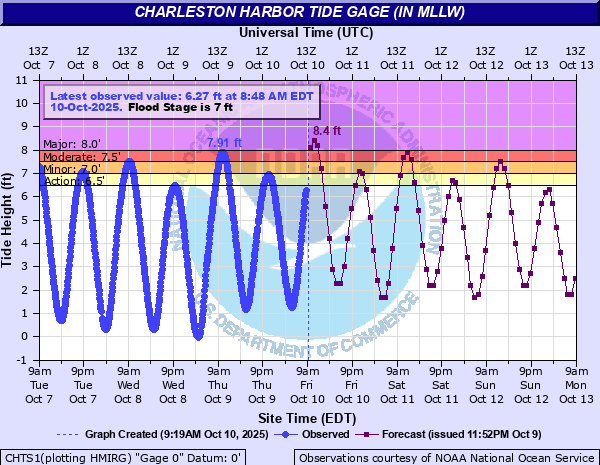
This would be the 15th highest tide level on record for this location. Fortunately, tide cycles after today should see more of a parallel to the coast and offshore component to the wind, which will allow for less trouble in Charleston.
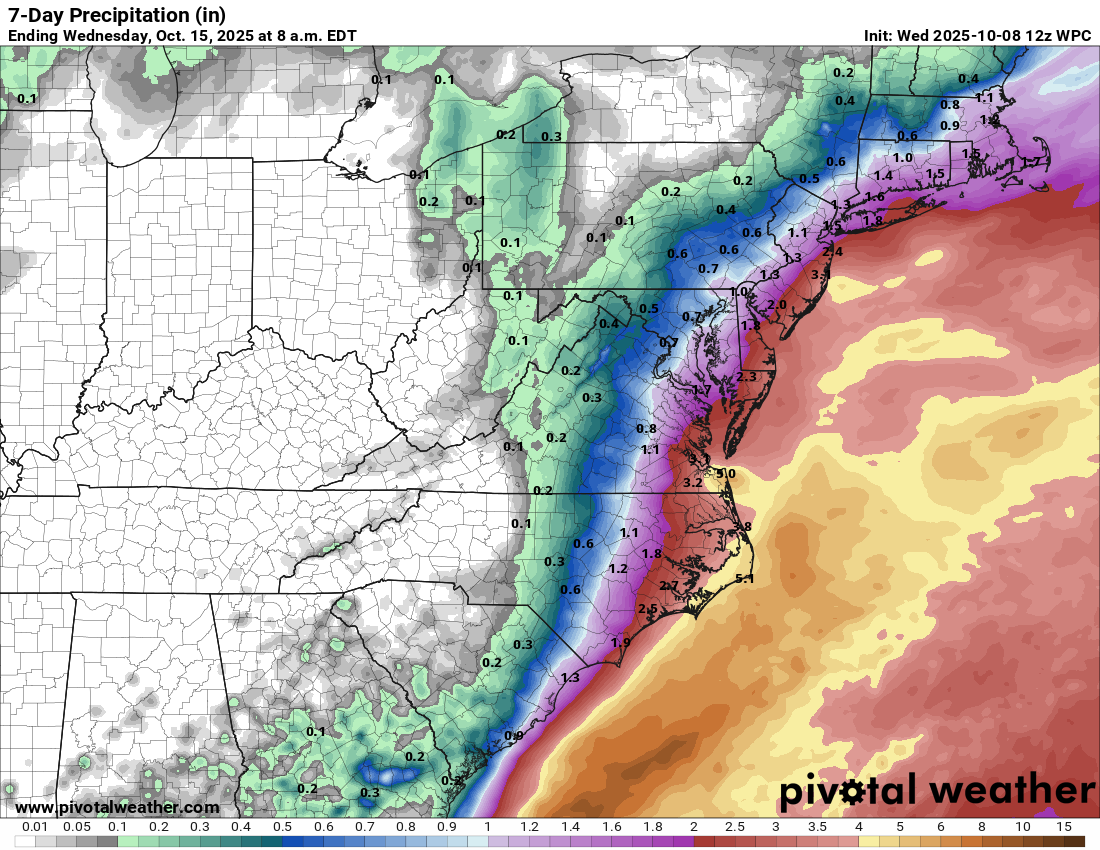
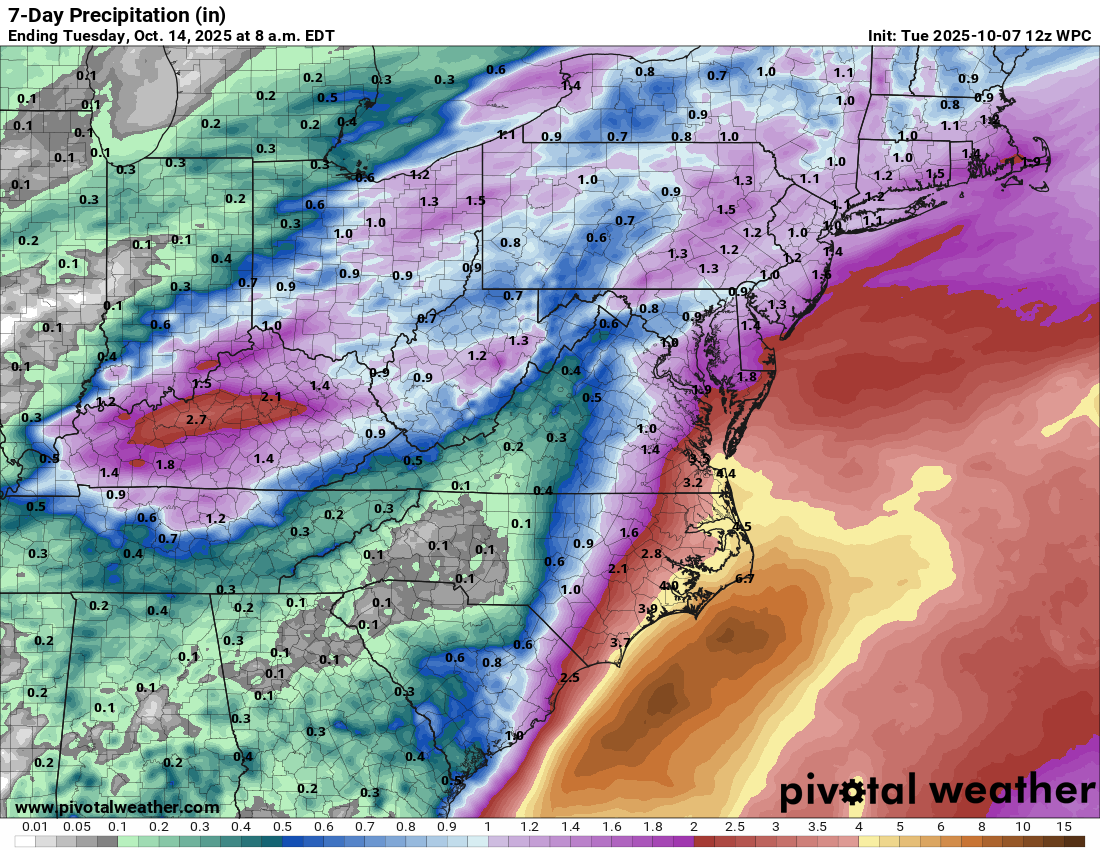
But the problems will just be beginning farther up the coast. As the storm lifts north, it will get up to about New Jersey, slam on the brakes, and then backpedal toward the coast before eventually turning back east and south and away from land. The European model’s outcome is shown below.
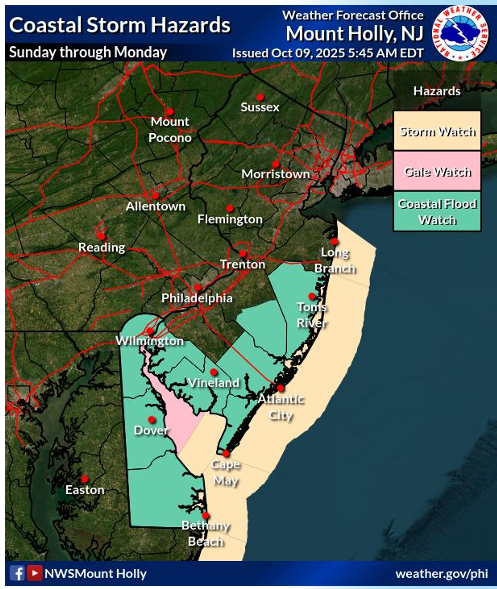
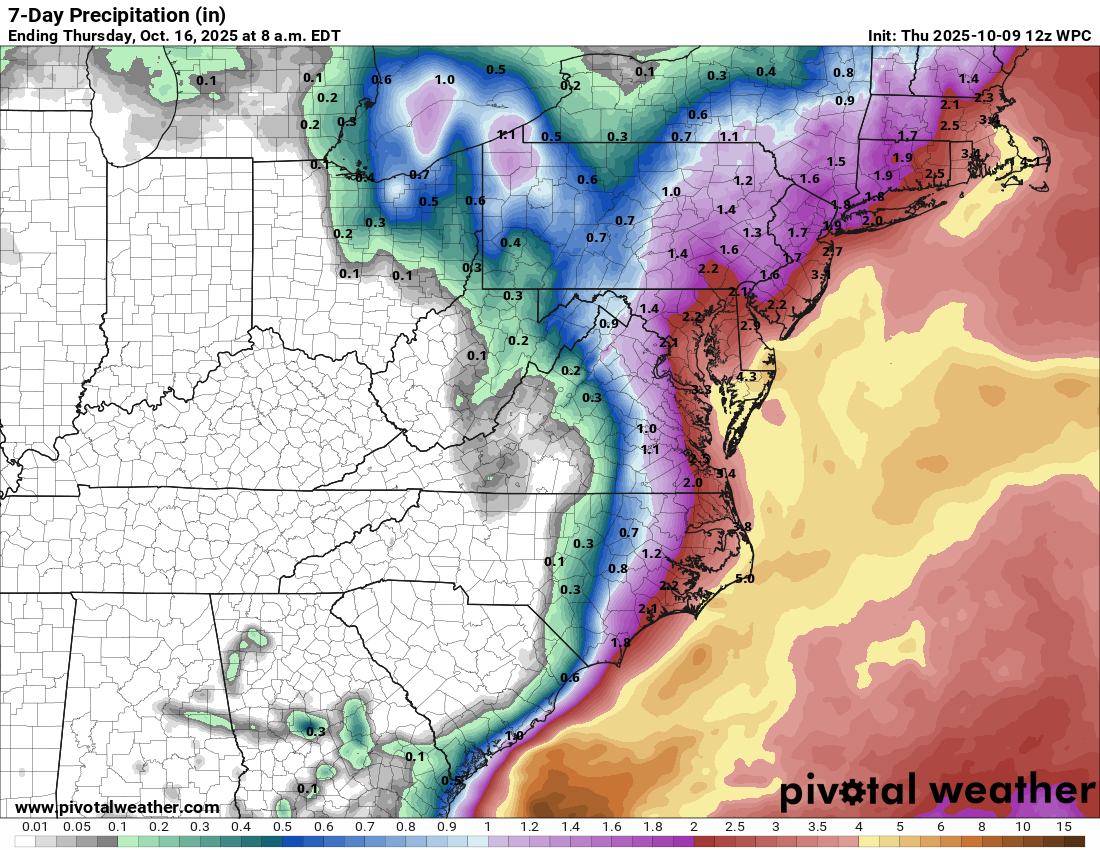
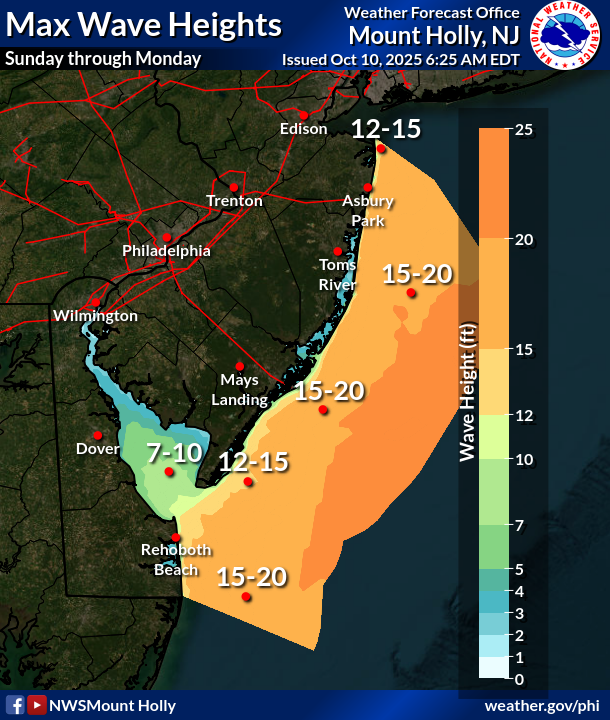
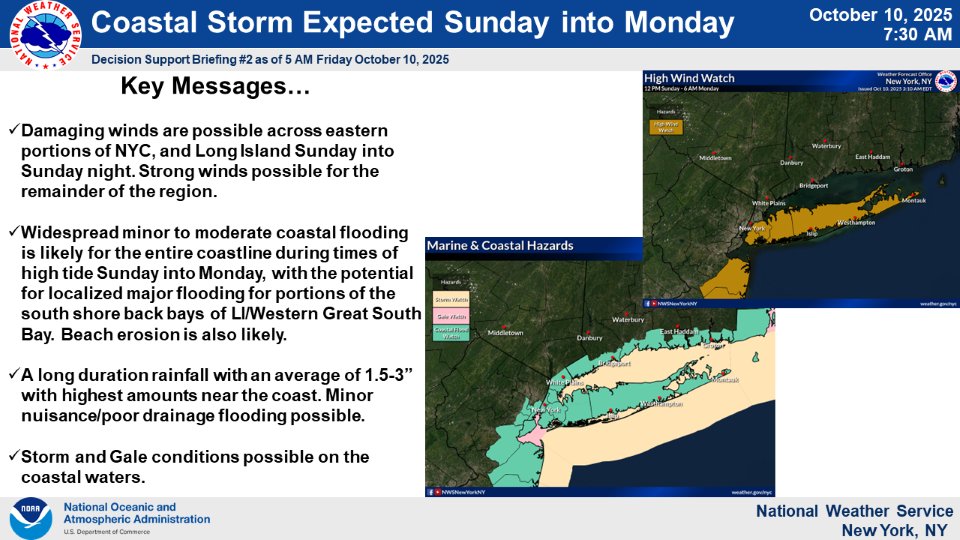
This means that the most significant impacts are probably going to end up occurring on the coast of Delmarva, New Jersey, and perhaps Long Island and southern New England. What does this translate to? Several high tide cycles of moderate to major coastal flooding, waves of 15 to 20 feet, beach erosion, 30 to 50 mph winds with higher gusts possible, and 1 to 3 inches of rainfall. This will occur mainly Sunday and Monday.
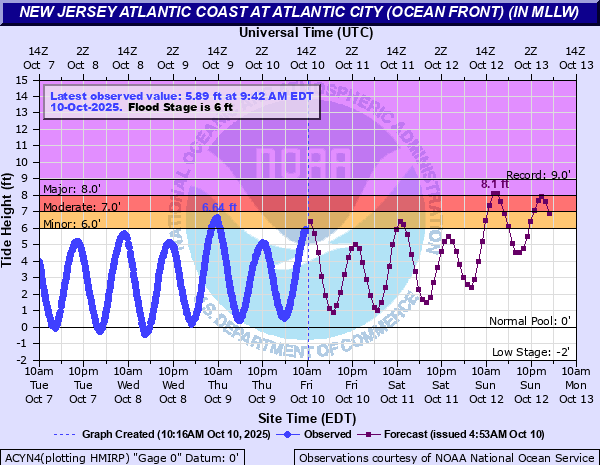
The current Sunday high tide forecast for Atlantic City reaches 8.1 feet in the morning high tide cycle, which would be the highest since Hurricane Sandy in 2012 (8.76 feet).
For the back bays in Jersey, it looks like the highest tides since the January 2016 nor’easter (“Winter Storm Jonas or “Snowzilla”). For Cape May, this looks to be the highest since 2016 as well, which set the record there (9.36 feet). Lewes, Delaware will come close to that as well. The current forecast is 8.8 feet. Farther up the Jersey Shore, on LBI this will be the highest tide since Sandy. For the northern coast of New Jersey, more moderate type flooding is expected.
For Long Island and southern New England, since the storm stays a bit to the south, tides will be kept in check a bit, with minor to moderate flooding likely. The more severe impacts will occur from southern New Jersey into Delmarva.
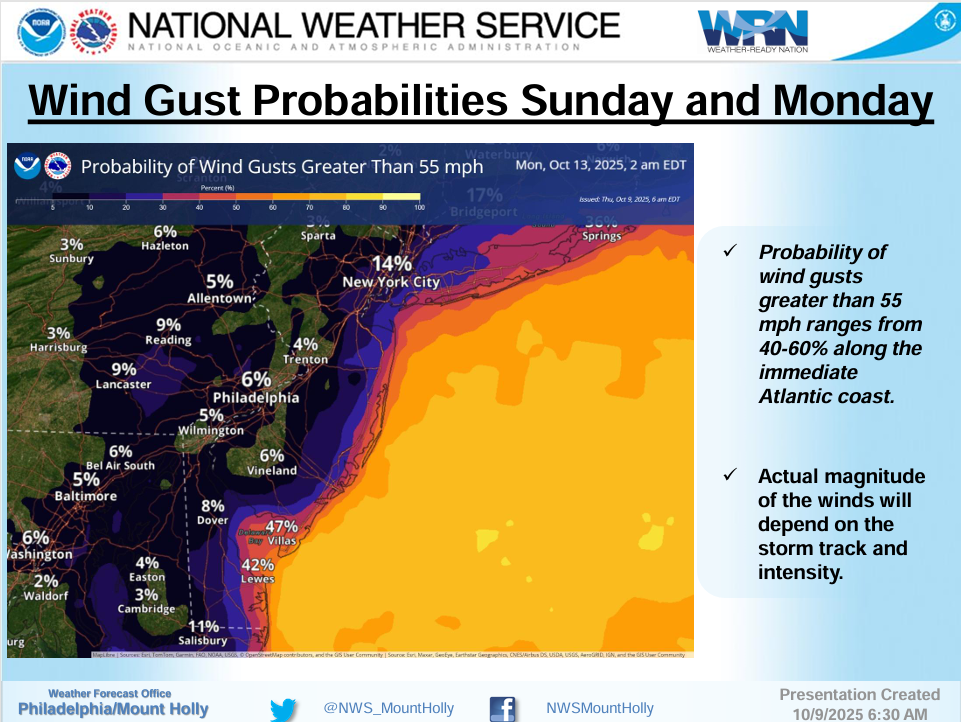
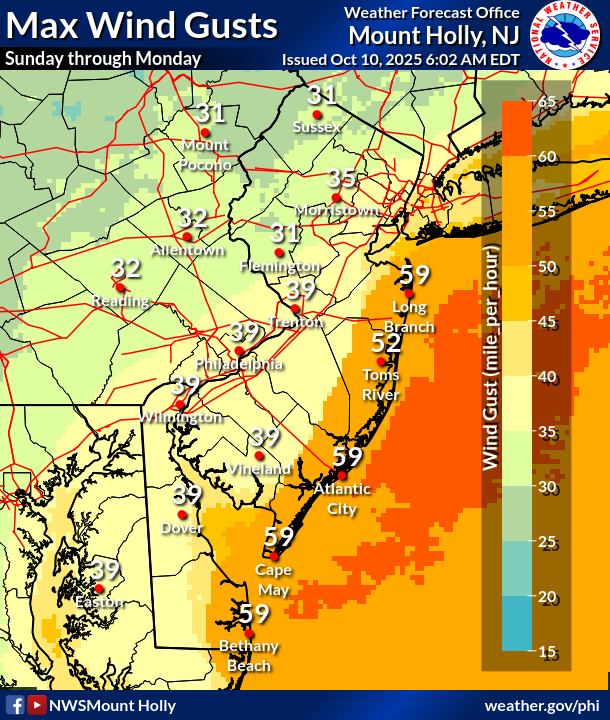
Wind gusts look potent with this storm. This will be akin to a strong nor’easter that you’d see in winter. Gusts of 40 to 60 mph are likely.
In addition to the coastal flooding and strong winds, the waves will be significant, 20 feet offshore and very high nearshore. This is the type of storm that, lingering for 36 to 48 hours will produce substantial beach erosion, including eating away at dunes. Expect to see those “cliffs” you often get after big storms on the beachfront in places like Ocean City, NJ.
We will also see 1 to 3 inches of rain as noted above, so some urban flooding is possible for some of the denser coastal communities, as well as perhaps up in the New York City area, particularly southern parts of Brooklyn and Queens and southern Nassau and Suffolk Counties.
Farther south, coastal flood advisories are posted in Virginia and North Carolina, along with coastal flood watches for Hatteras and Ocracoke Islands. The current tidal forecast in Norfolk on Sunday at Noon is 6 feet, which would be the second 6 foot tide this year, which would be roughly a 1-in-10 year type of event.
Bottom line: This storm, despite not being tropical in nature, will bring some of the most significant impacts to the South Jersey Shore and northern Delmarva since at least January 2016, possibly since Hurricane Sandy. It should be taken seriously. Elsewhere, this will be a significant coastal storm with noteworthy impacts that should be planned for.
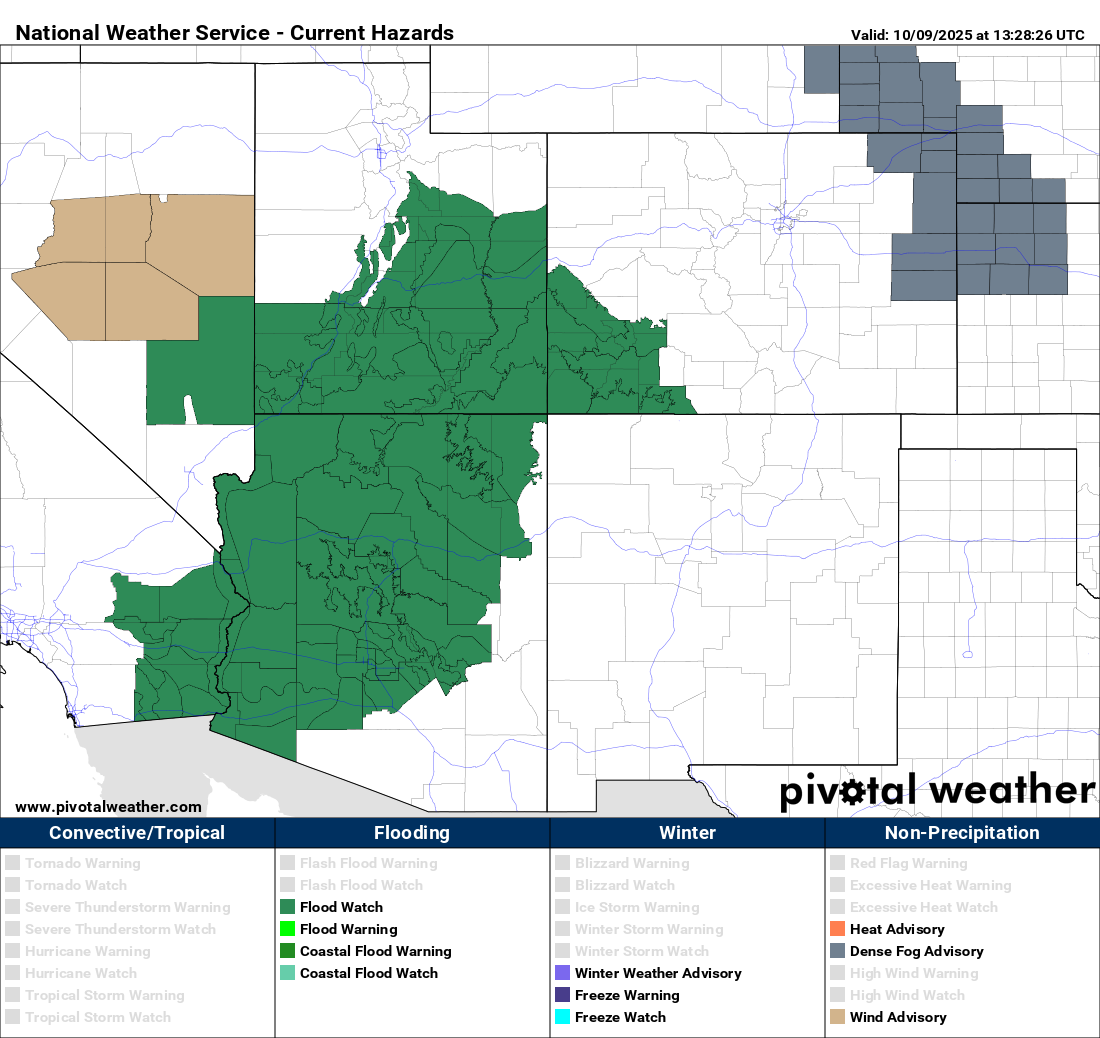
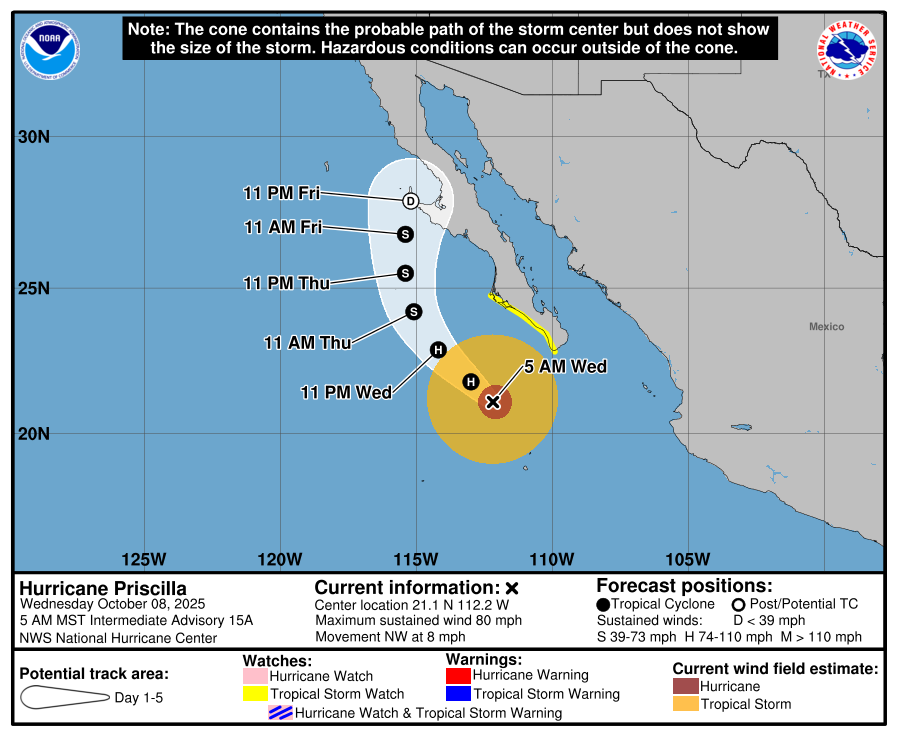
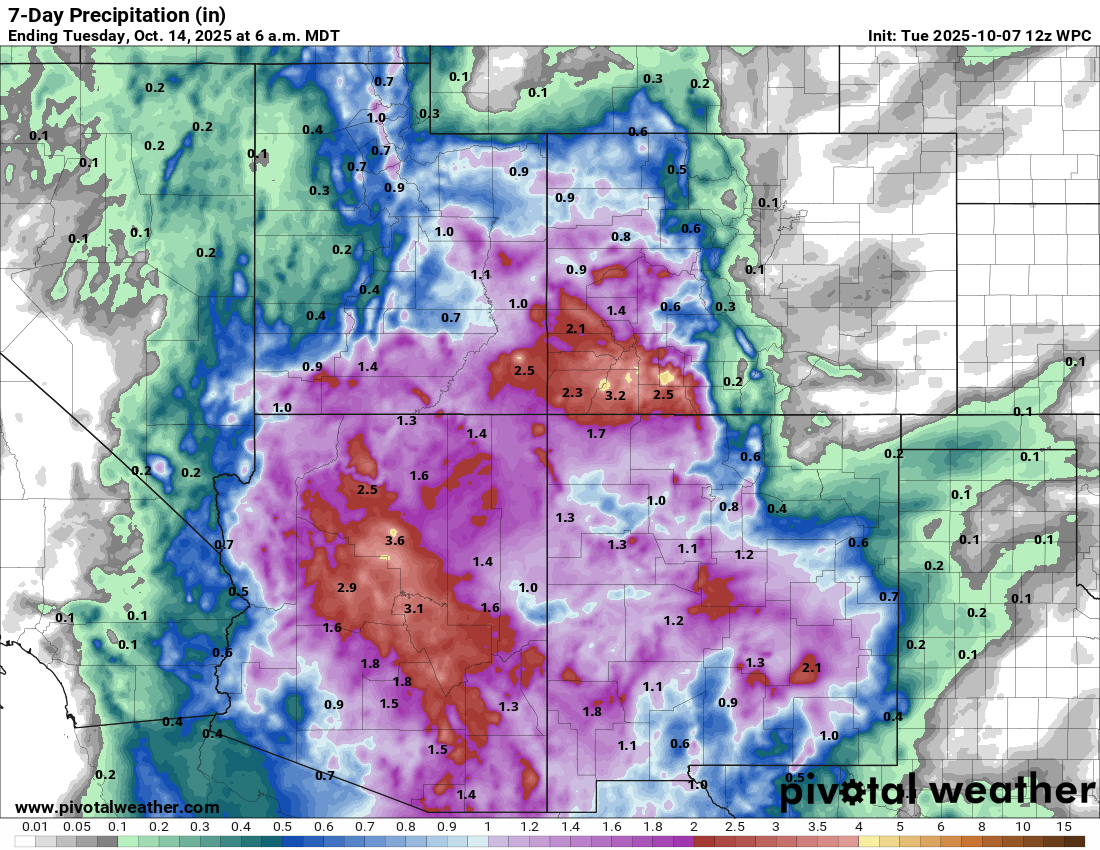
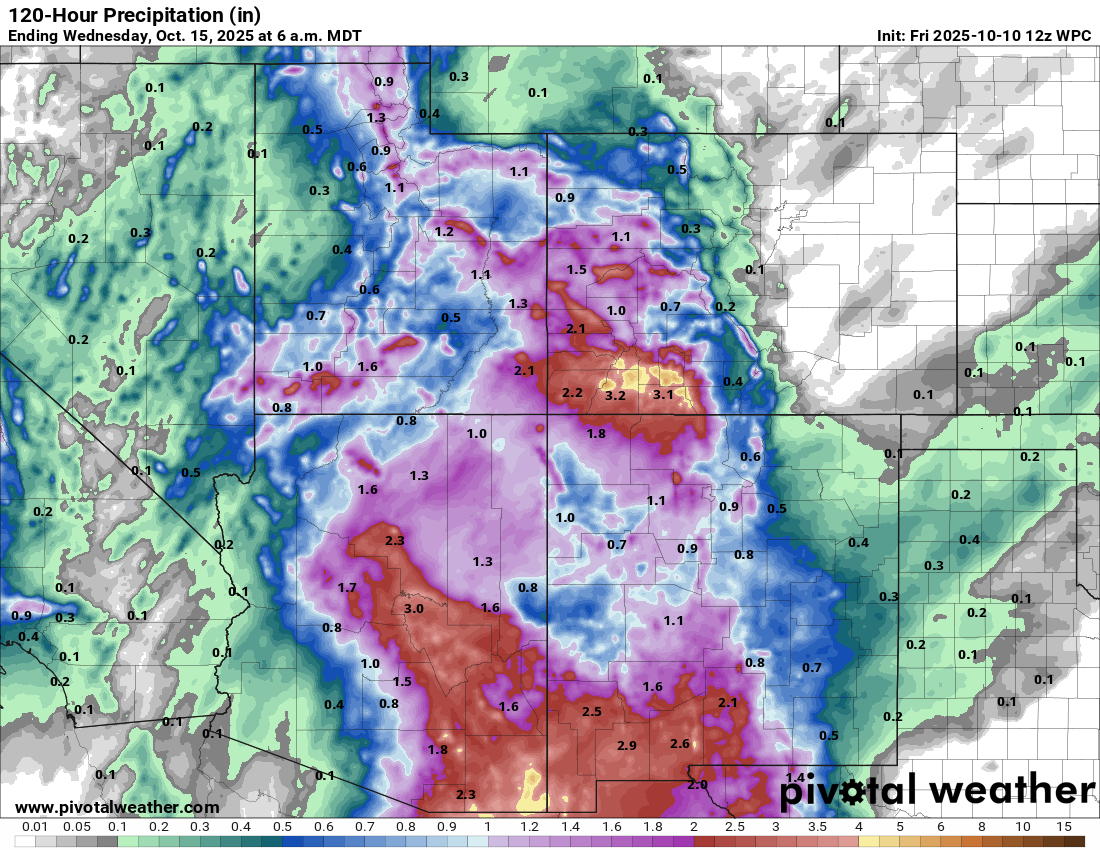
Southwest rains
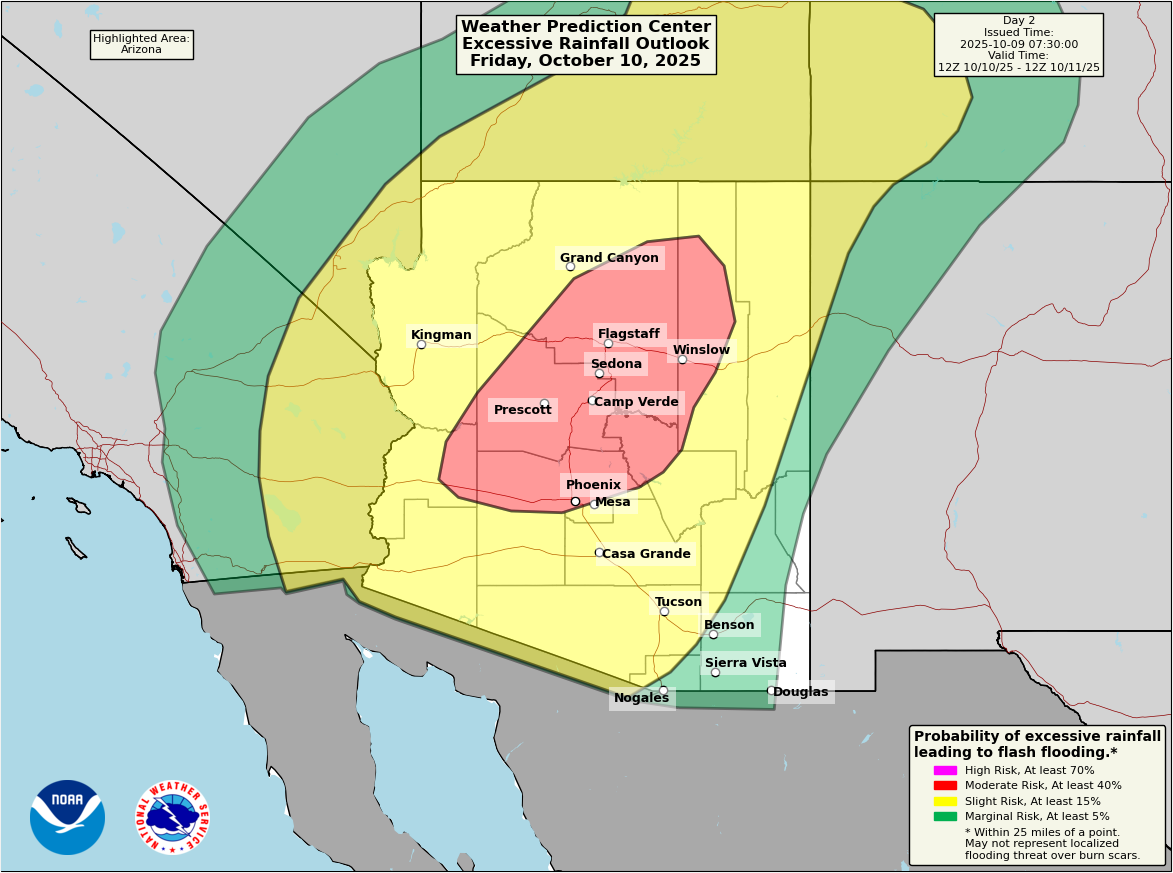
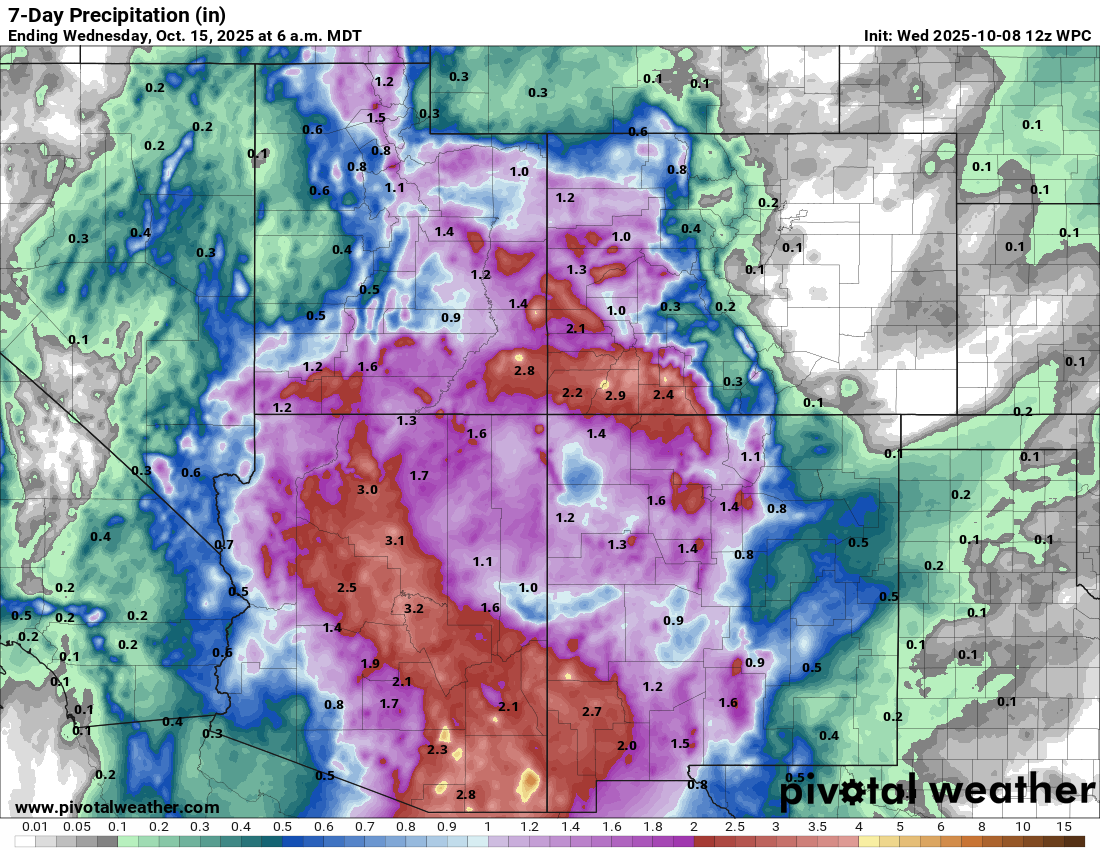
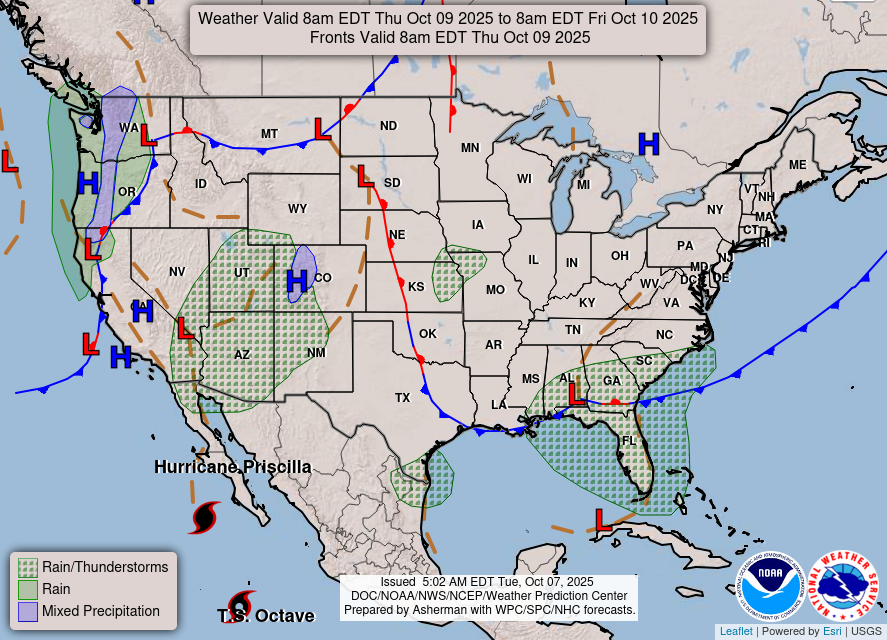
From the ocean to the desert now. Flood watches are posted all over the Desert Southwest ahead of the moisture from Priscilla’s remnants moving into the Southwest.
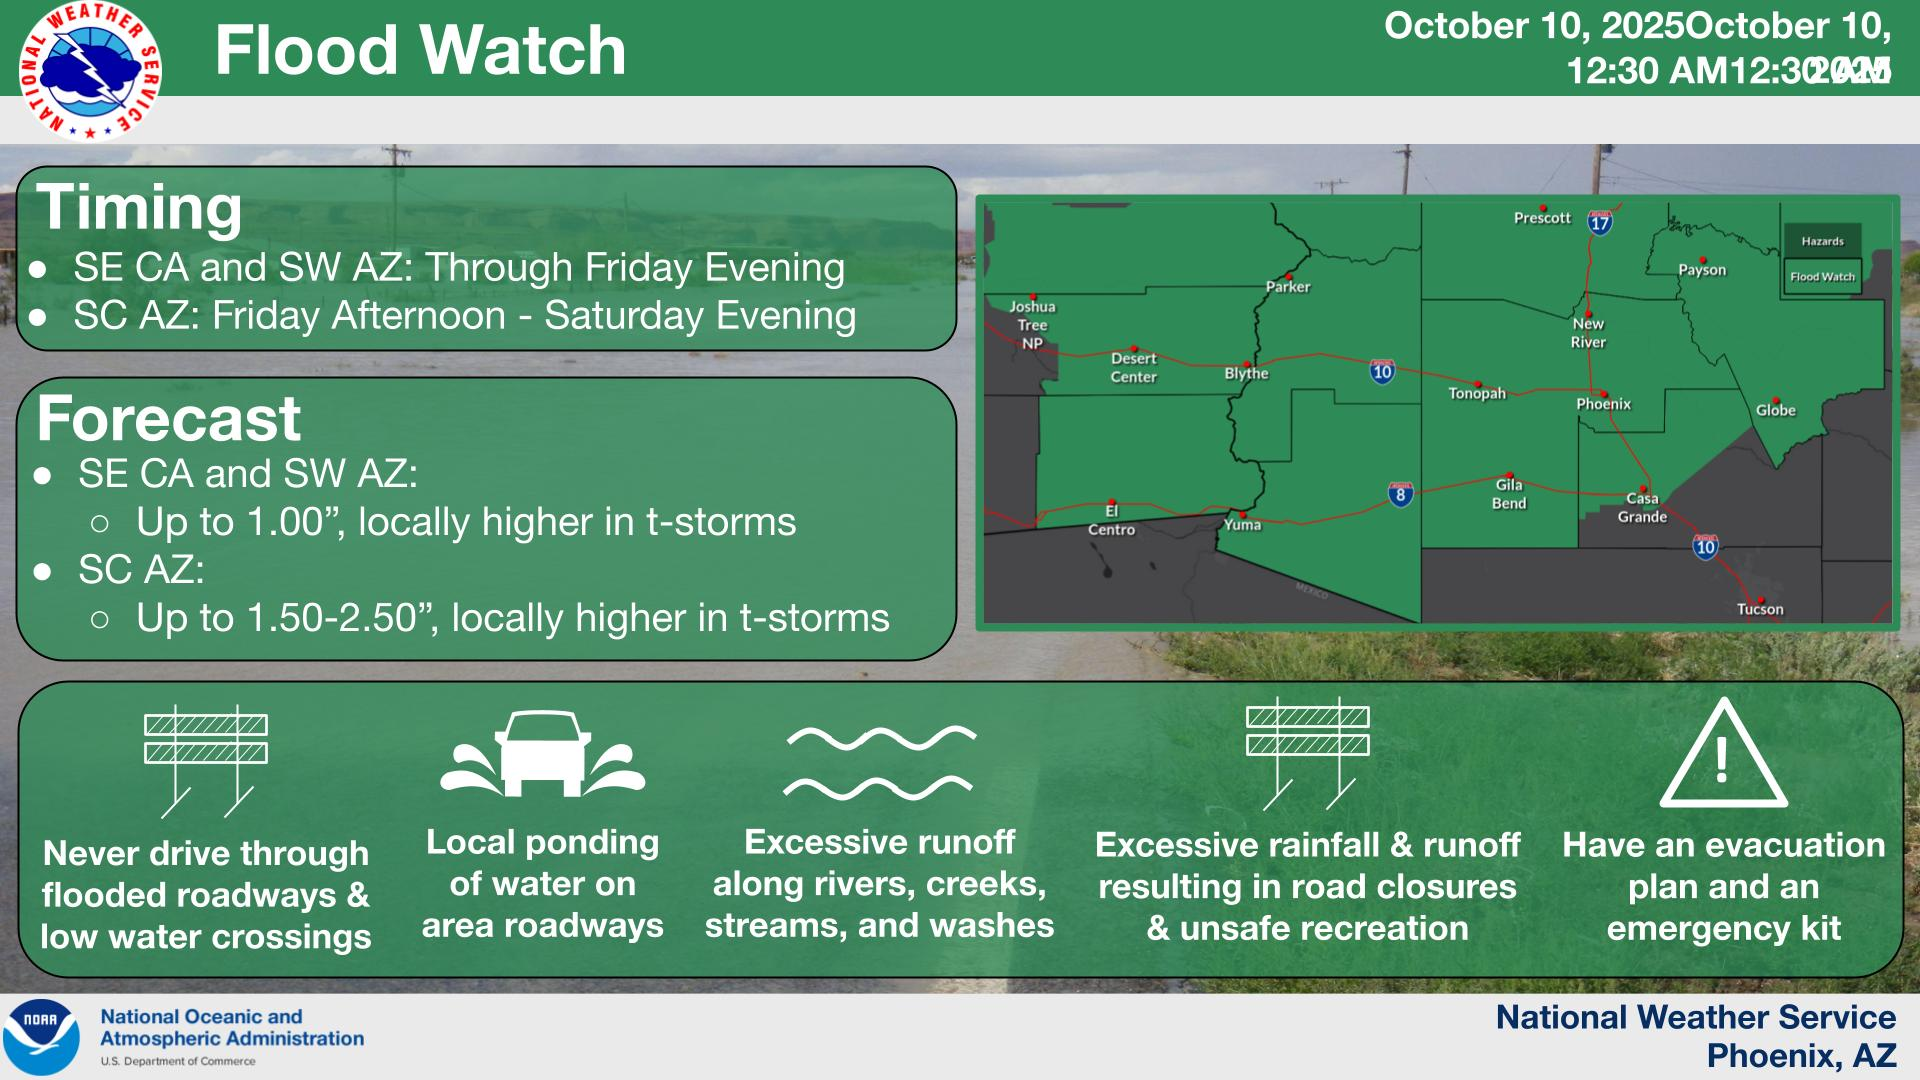
With the flood watches, we have a couple moderate risks for flash flooding today (level 3 of 4).
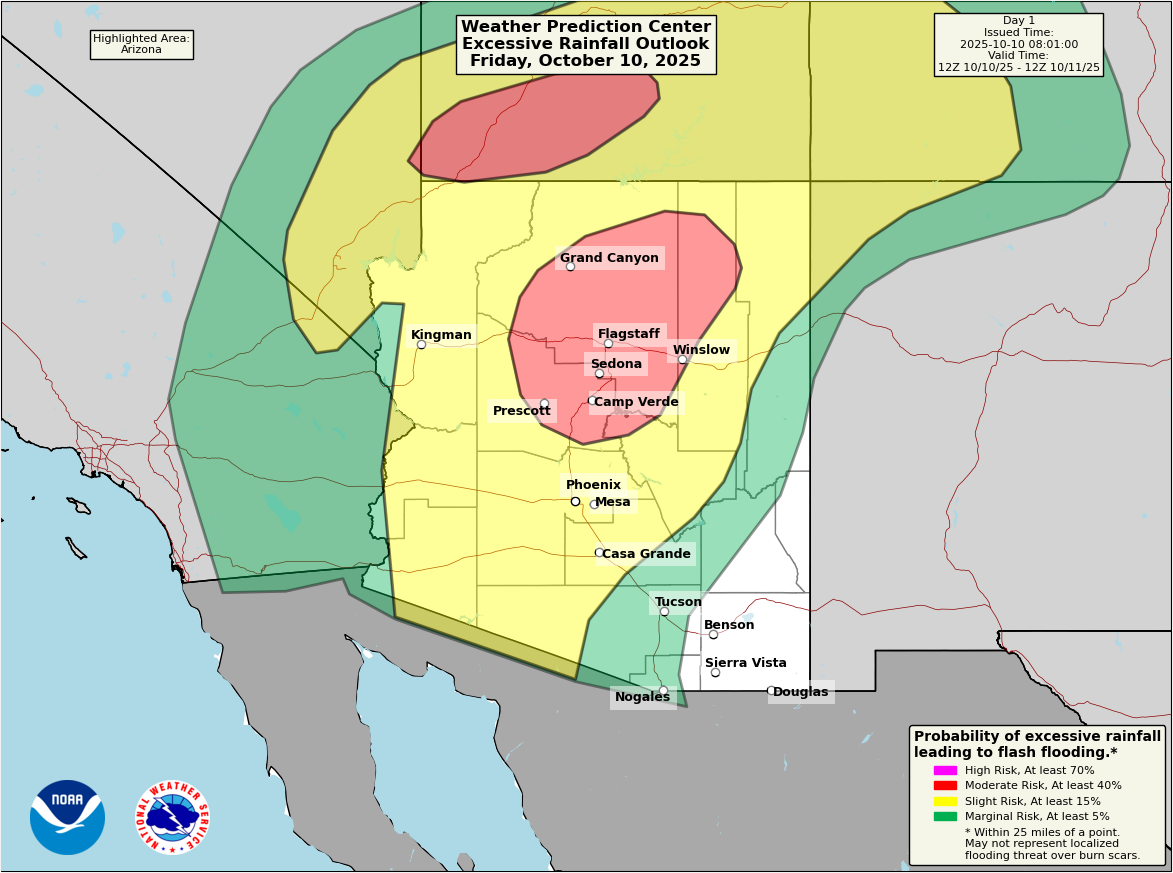
These moderate risks include the Grand Canyon, as well as the southern Utah national parks. Flash flooding can come on very quickly in the deserts, particularly in some of these rugged national park, monument, and wilderness areas. Keep in mind due to the government shutdown, staffing at these locations may be minimal, so risk of getting into trouble without getting quick help is higher than usual.
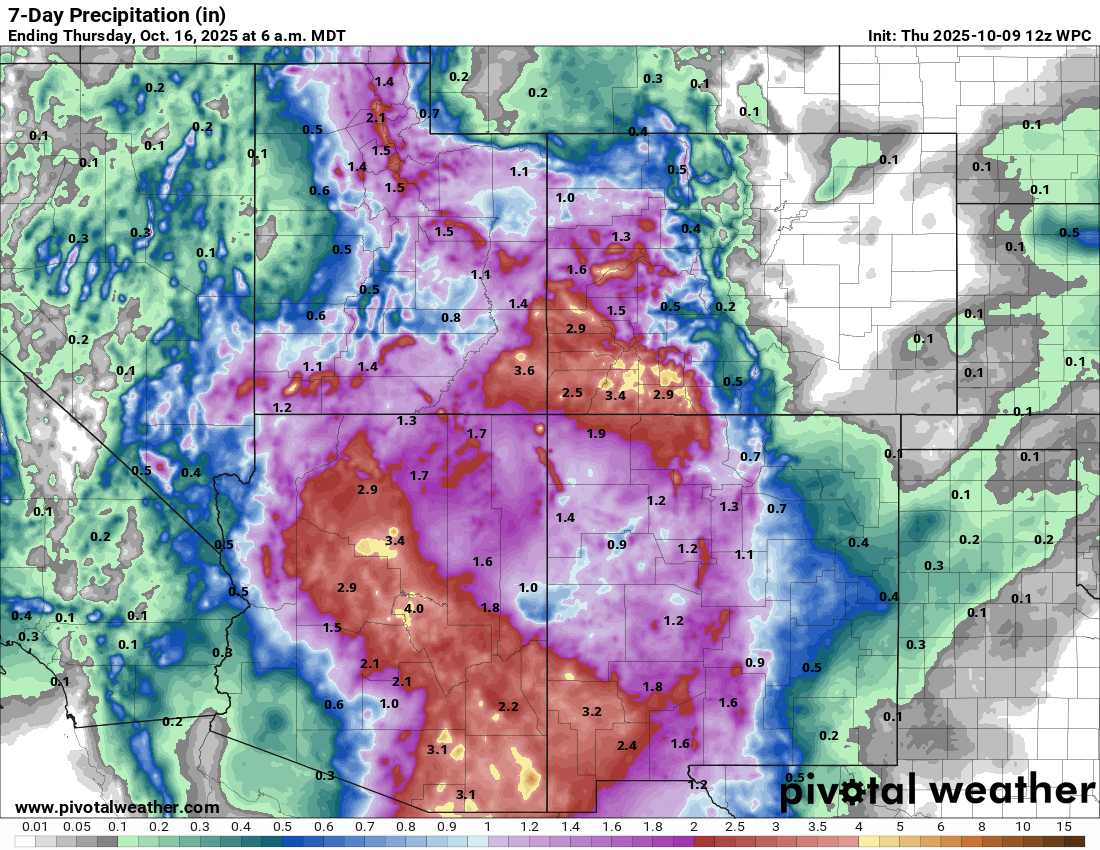
Total rainfall over the next 3 to 5 days will be on the order of 1 to 3 inches in much of Arizona and New Mexico, as well as Utah and western Colorado. Flash flooding is obviously a concern, particularly around places that see locally higher amounts. But much of this rain will be beneficial for reservoirs in the West, particularly given how bad 2025 has been out here.
Another thing we’ll watch is if Tropical Storm Raymond in the Pacific can further add moisture to the pile out West next week.
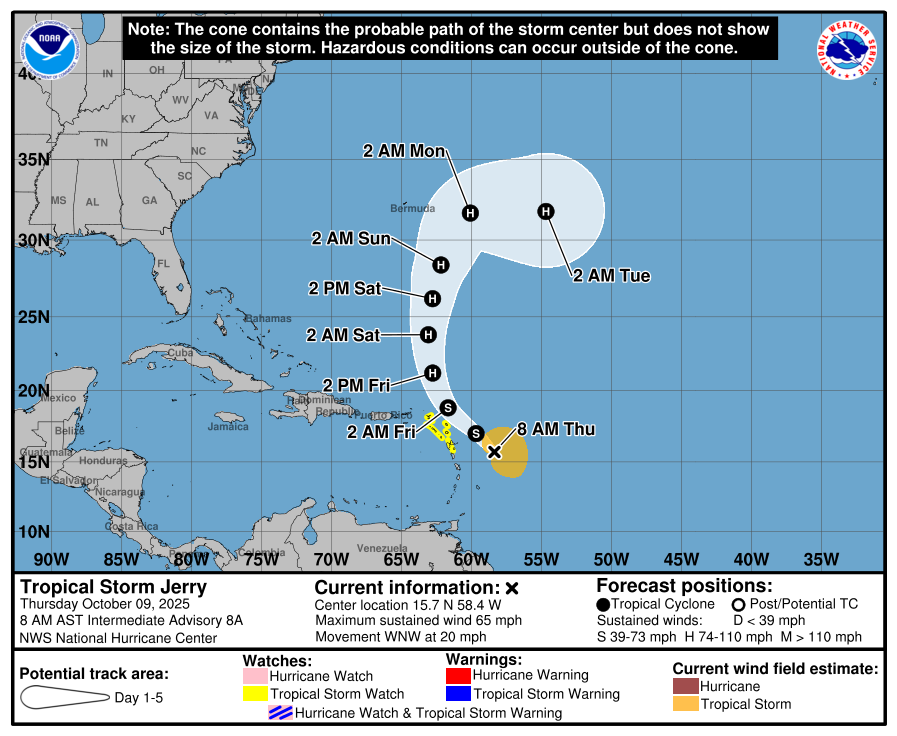
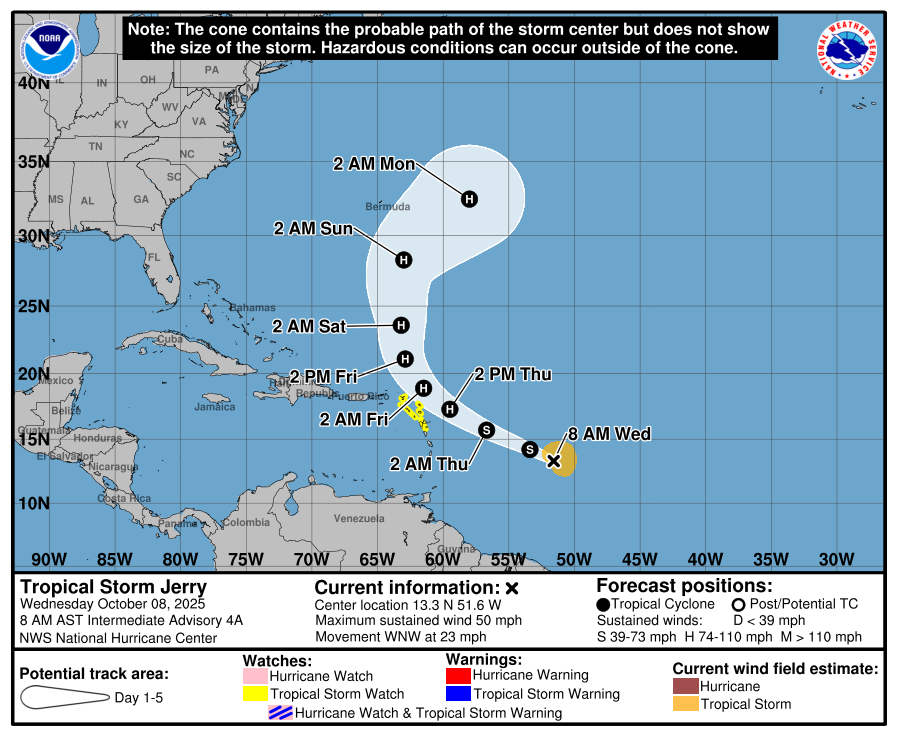
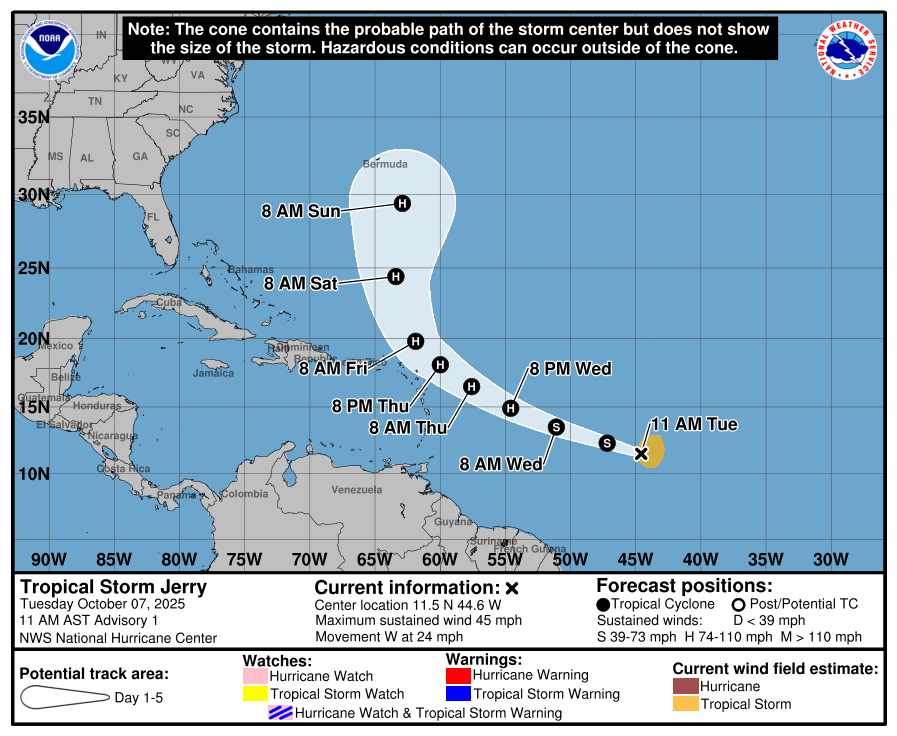
TS Jerry & Karen
Quick notes on the tropics today. No land impacts are expected now from Jerry or newly formed Karen in the far, far, far north Atlantic.
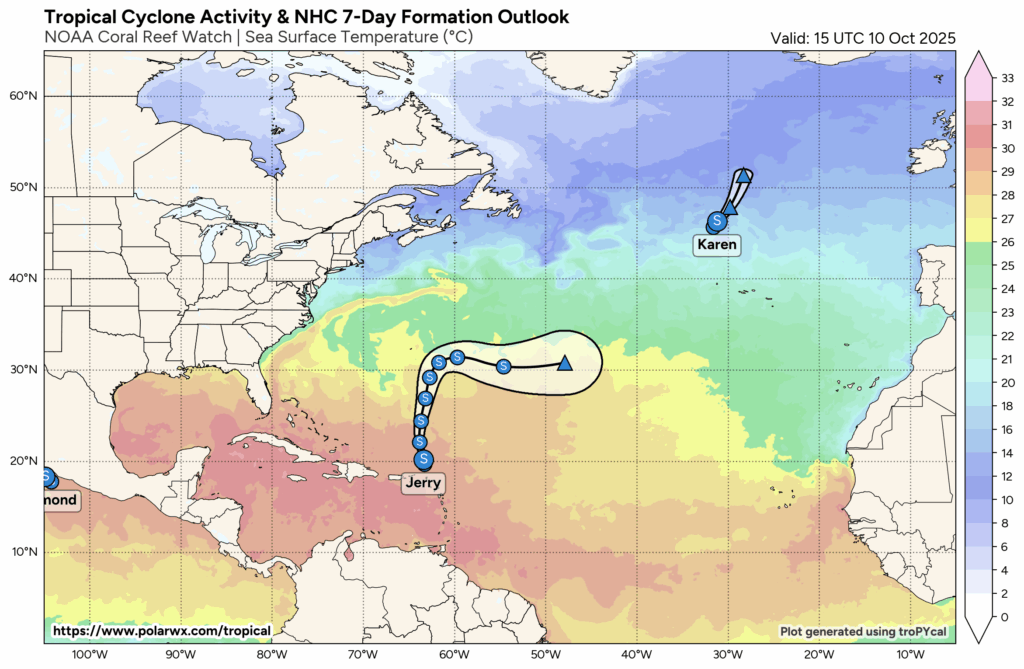
While not totally unprecedented to see storms track this far north, Karen was the farthest north forming subtropical storm in the Atlantic since the 1950s. Obviously, much of this is likely due to technological improvements allowing us to classify storms like this today that perhaps 50 to 75 years ago would have slipped through the cracks. Warmer than normal water surely doesn’t hurt either.
Other than these systems, the Atlantic looks quiet.