In brief: Our second part of the 2025 season in review takes us from Hurricane Erin in August through Hurricane Gabrielle in September.
Part one of our 2025 recap can be found here.
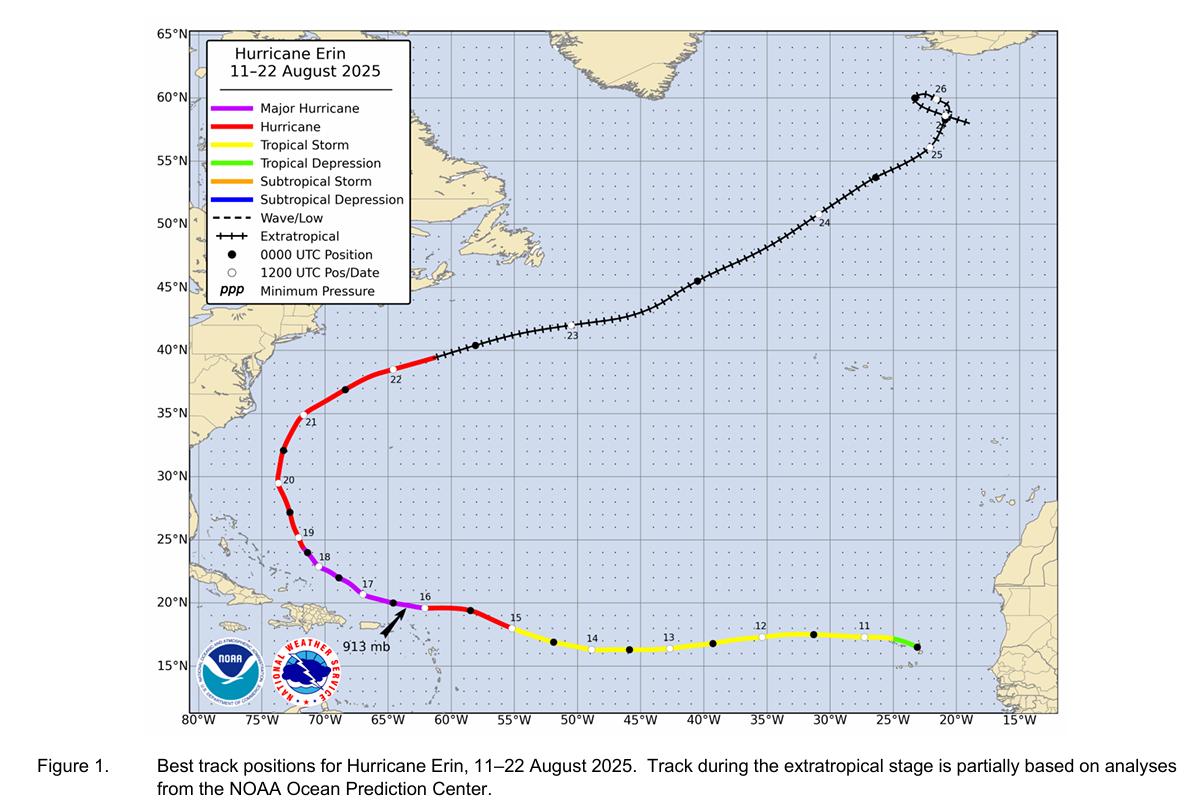
Hurricane Erin (August 11-22)
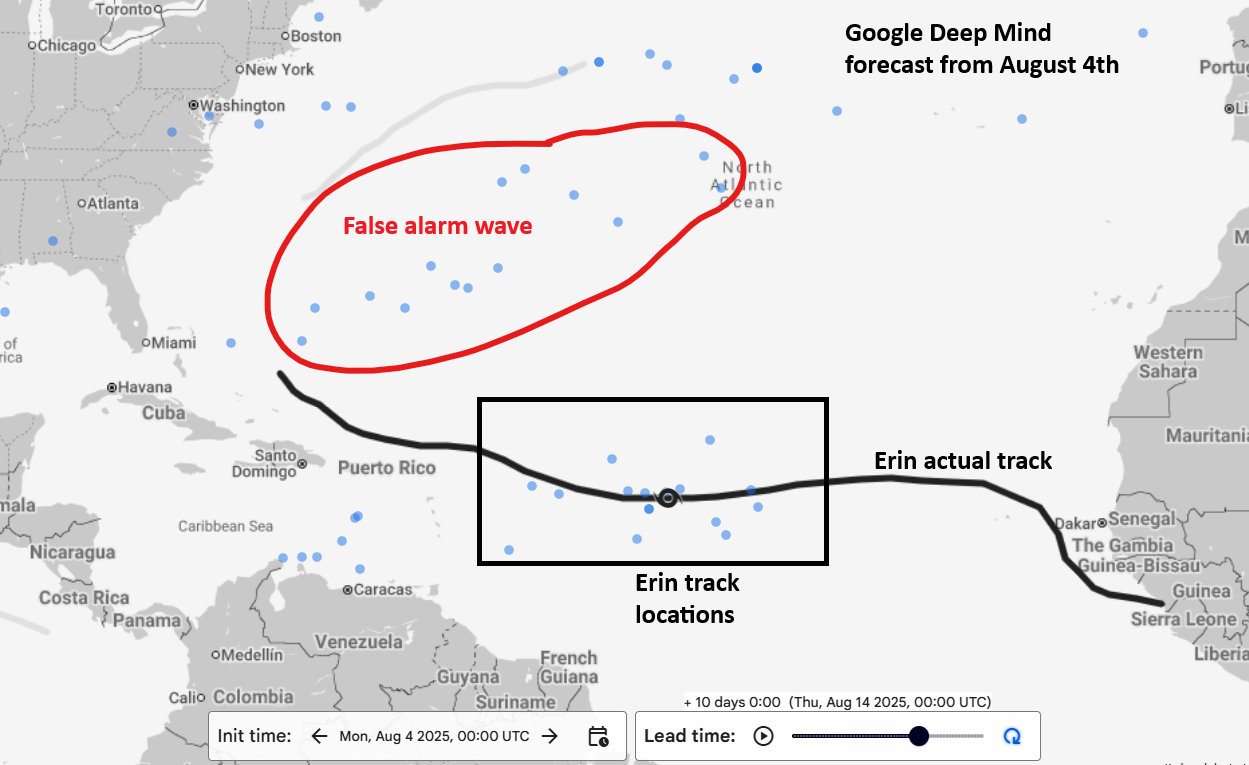
The first signs of Erin came a bit late in the game. We had been tracking a system in front of where Erin would develop that was highlighted in NHC outlooks as far in advance as August 2 or 3. As noted in our previous season in review post, there were a few cases of false alarms last season from the European model in particular, and that was one.
Google’s Deep Mind model did capture the potential for Erin well in advance. In fact, a week before genesis, Google Deep Mind’s model showed both risk of Erin, as well as the false alarm wave we had been monitoring ahead of Erin.
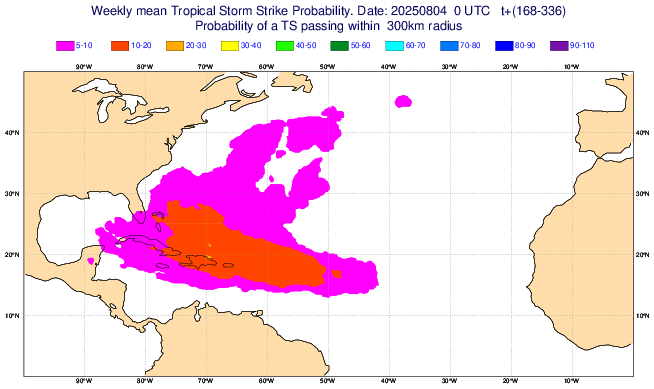
So no models were immune from false alarms, but the consensus on Erin gradually picked up as time went on. On August 5th, we noted how the European weekly model had a higher area of activity potential near the Caribbean as well.
By August 8th, speculation on future Erin had begun increasing, with some operational model guidance bringing Erin as far west as the Southeast U.S. By the 9th, we had Invest 96L from the false alarm wave ahead of Erin, with diminishing development odds. But odds on Erin were increasing. Models were in great agreement on potential for a system and a stronger one, and things just kind of progressed from there.
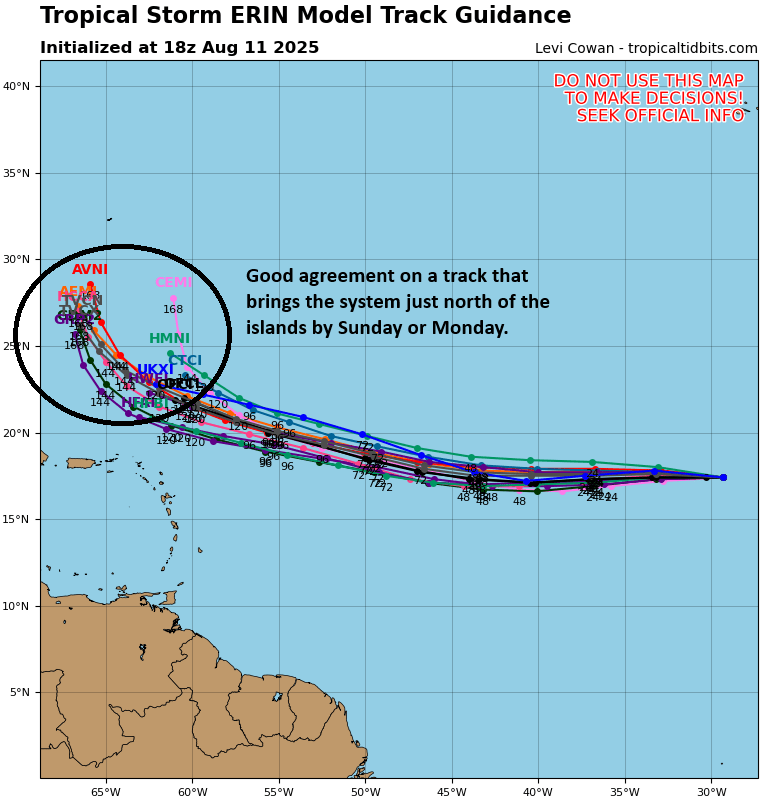
Erin was dubbed Invest 97L before formation, with the biggest forecast uncertainty on how much space it would have to turn northwest once near the Caribbean islands. By the morning of the 11th, confidence in that turn northward was increasing, and Erin was classified as a tropical storm that afternoon.
Erin struggled out of the gate, with most of its thunderstorm activity abandoned by the morning of the 12th. Two days later, Erin had put itself together nicely with a much nicer satellite presentation and the beginnings of organization. 48 hours after it had 50 mph sustained winds, early on the 14th, it had jumped to 110 mph winds early on the 16th. It then peaked in intensity on the afternoon of the 16th as a 160 mph category 5 storm.
As Erin moved northwest and then northward, it grew in size, eventually reaching the 92nd to 95th percentile of all hurricanes on record north of 20°N latitude.
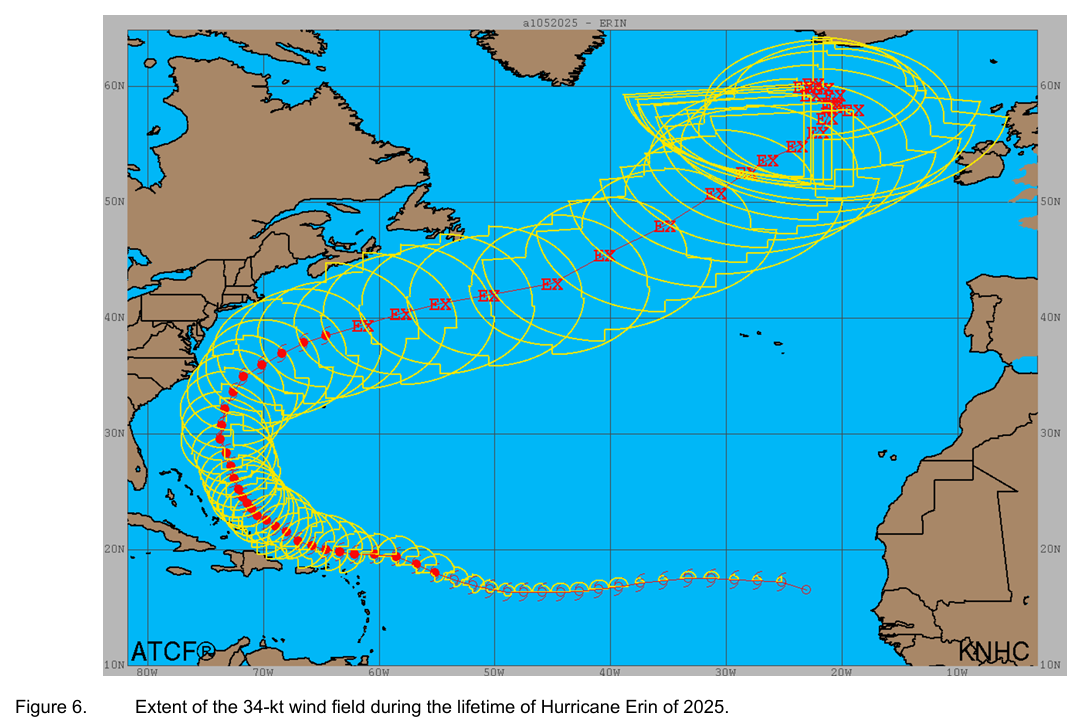
Despite the size, the strongest wind report at any land location came from Anegada in the British Virgin Islands, which had 61 mph sustained winds, gusting to 74 mph. Erin’s size did allow for some tropical storm force wind gusts to occur from New Jersey through North Carolina in addition to widespread coastal flooding. Impacts from Erin included severe rain and several drowning deaths in the Cabo Verde Islands, as well as flooding and landslides in the British Virgin Islands. Two structures in Buxton, NC sustained major damage, with around $3.1 million in damage from North Carolina and $25 million in total damage. Thirteen deaths (including the 7 noted above) can be attributed to Erin.
For track forecasts, the HAFS-A model, Google Deep Mind model, and the HCCA consensus model seem to have been the best performers for Erin. For intensity, the backpat probably goes to the consensus models, the HMON, and Google’s Deep Mind. Read the full report here.
Tropical Storm Fernand (August 23-27)
Our sixth storm of the season, Fernand was a classic low-end fish storm. Maximum winds reached just about 60 mph, and there was no damage reported as it stayed out at sea. Still, Fernand was actually pretty well forecast, having probabilities of development added several days in advance.
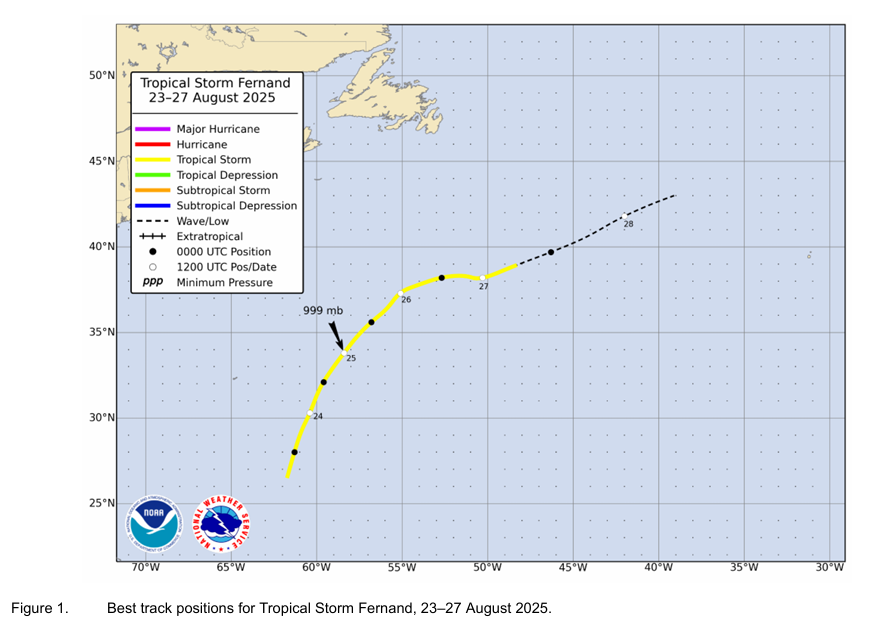
Google’s Deep Mind model again performed well here, as did some other model guidance. But aside from that, there was little of note to discuss with Fernand.
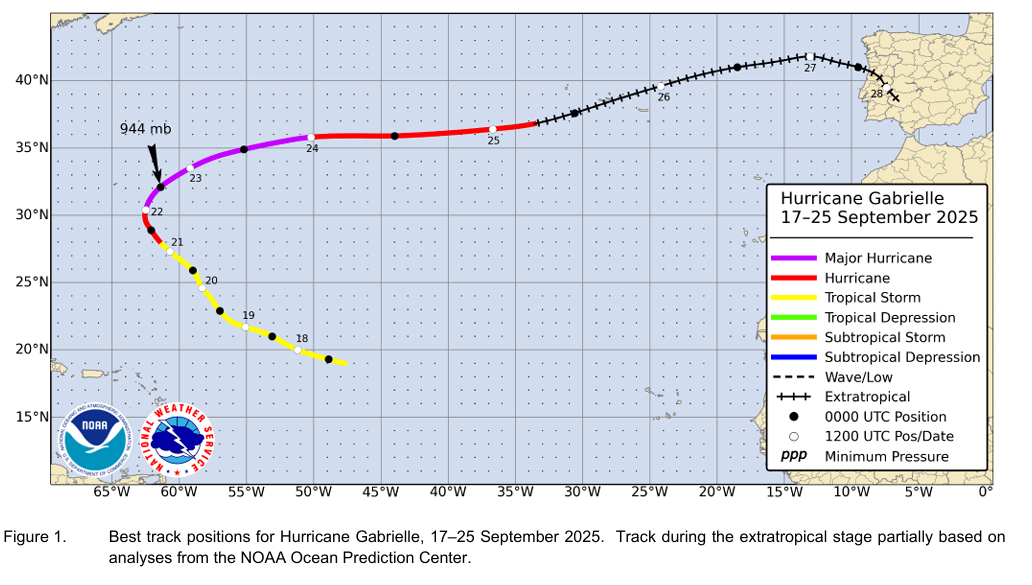
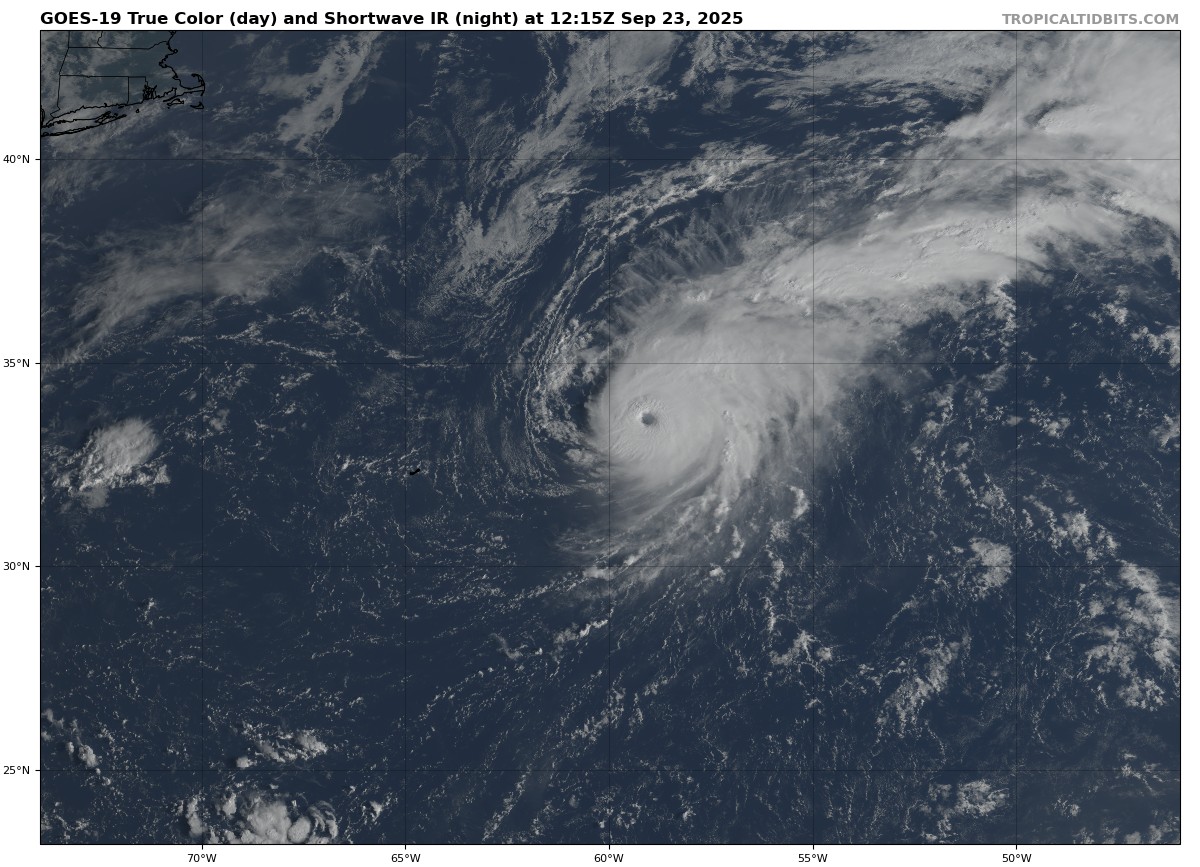
Hurricane Gabrielle (September 17-25)
We went several weeks again with little in the way of tropical activity in the Atlantic, through and beyond the peak date of September 10th, an extremely unusual feat. This was not a surprise in the moment, however. On August 23, we discussed the quiet that was expected in the Atlantic for the upcoming 2 to 3 weeks. In that gap we did have several waves emerge with some development odds — and they failed. One consistent theme of 2025’s hurricane season was a lot of false alarm noise.
Things picked back up in the back half of September with Gabrielle. Some signs of this began to emerge late in the first week of September on the modeling. The first NHC notation on the system to become Gabrielle did occur nearly 7 days in advance with slowly, steadily increasing odds of development as time went on. Overall, Gabrielle was well predicted in advance, perhaps the best of 2025.
Gabrielle skipped the depression phase and jumped right into tropical storm status on the 17th. At the time, the NHC had classified it as a depression, but in the post-storm analysis, it was determined that Gabrielle didn’t have a firm center at that time and had actually reformed one to the north of where it had originally been analyzed which means it actually became a tropical storm around the afternoon of the 17th, not a depression the morning of. Every scientific field has their nuances to iron out, and this is one of them in meteorology.
Gabrielle pressed off to the northwest over the next few days, struggling, slowing, and turning north and northeast to the east of Bermuda. Gabrielle underwent a spurt of rapid intensification, strengthening from a 65 mph tropical storm early in the morning of the 21st to 90-95 mph on the morning of the 22nd to 140 mph on the morning of the 23rd.
Gabrielle tracked off to the northeast and east over the next few days, arriving in the Azores around the 26th. One site (Faial) reported sustained winds of 48 mph, gusting to 96 mph as Gabrielle’s non-tropical circulation arrived. There was even a report of 115 mph winds in the mountains atop one of the islands there. Thankfully, damage was limited. Gabrielle continued as a remnant low into Portugal before dissipating.
Google’s Deep Mind model did great with Gabrielle’s track forecast, but virtually no other models beat the NHC’s track or intensity outlook within 120 hours.