In brief: We begin a look back at the 2025 Atlantic Hurricane Season, as we dive in on Tropical Storm Andrea and conclude with Tropical Storm Dexter and a deeper look at why the season went so calm.
Welcome to our hurricane season in review. There’s always weather to talk about, but since our bread and butter is tropical weather here at The Eyewall, it makes sense to recap the previous season. As these storms develop, sometimes things move really fast, and you’re so focused on the potential impacts of the storms that it’s tough to take stock of what’s happening. A recap allows you a slower walk through the season. Much of what is taken here is some additional context from posts we made in the middle of the event, as well as from National Hurricane Center post-storm reports. We’ll plan to post our 3-parts over the next 3 weeks, as we’re just over a month from the start of hurricane season, a reminder to begin to think about preparedness.
Tropical Storm Andrea (June 23-24)
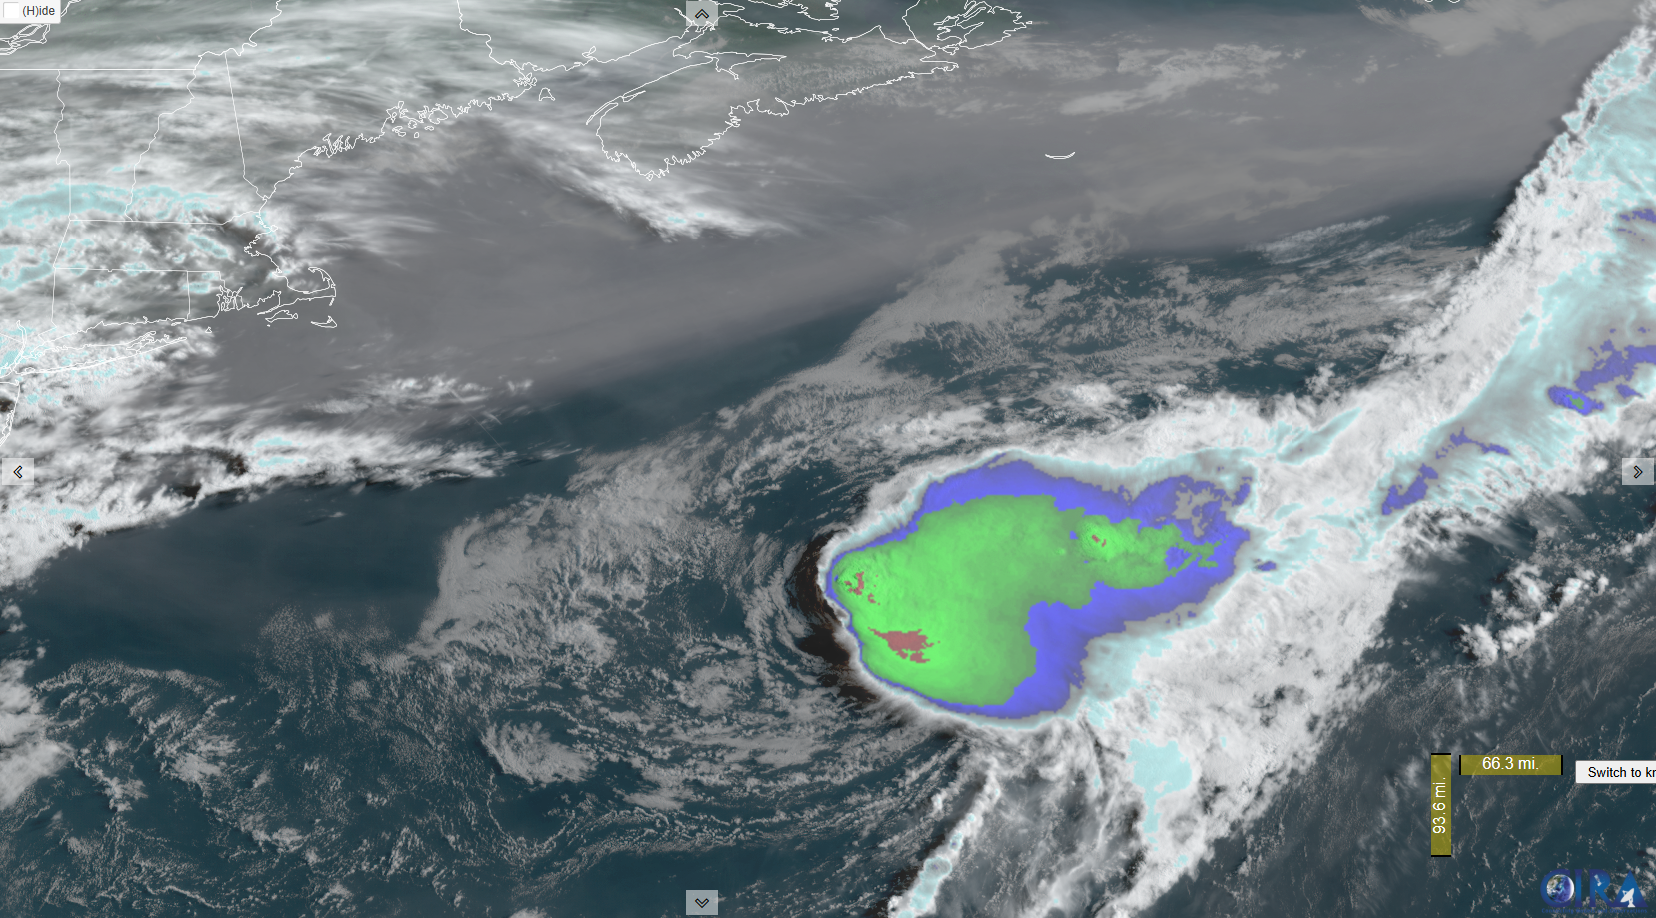
The first storm of the season was not much to write home about, as is often (but not always!) the case with June systems. Andrea formed east of Bermuda almost as a subtropical system as Invest 90L. In the post-season analysis, it was determined that Andrea had already formed into a tropical depression at the time of the satellite loop below.
While the first advisory on Andrea was not issued until the 24th, it was determined that Andrea actually became a depression on June 23 at 0600z (around 2 AM ET). By 12z, it was a tropical storm, and 30 hours later it had dissipated. Andrea maxed out with winds of 40 mph.
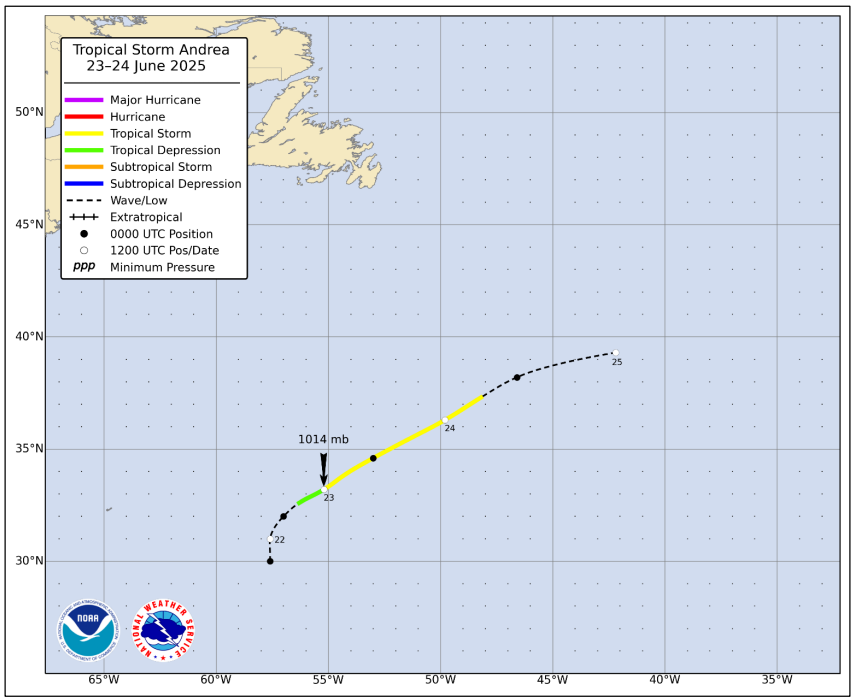
Andrea did not cause any damage, being out at sea and on the lower-end. It’s minimum pressure was a paltry 1014 mb, which is rather high for a tropical storm. No official modeling was done on Andrea, but Google’s Deep Mind model did do an adequate job suggesting low-end potential a couple days prior to development.
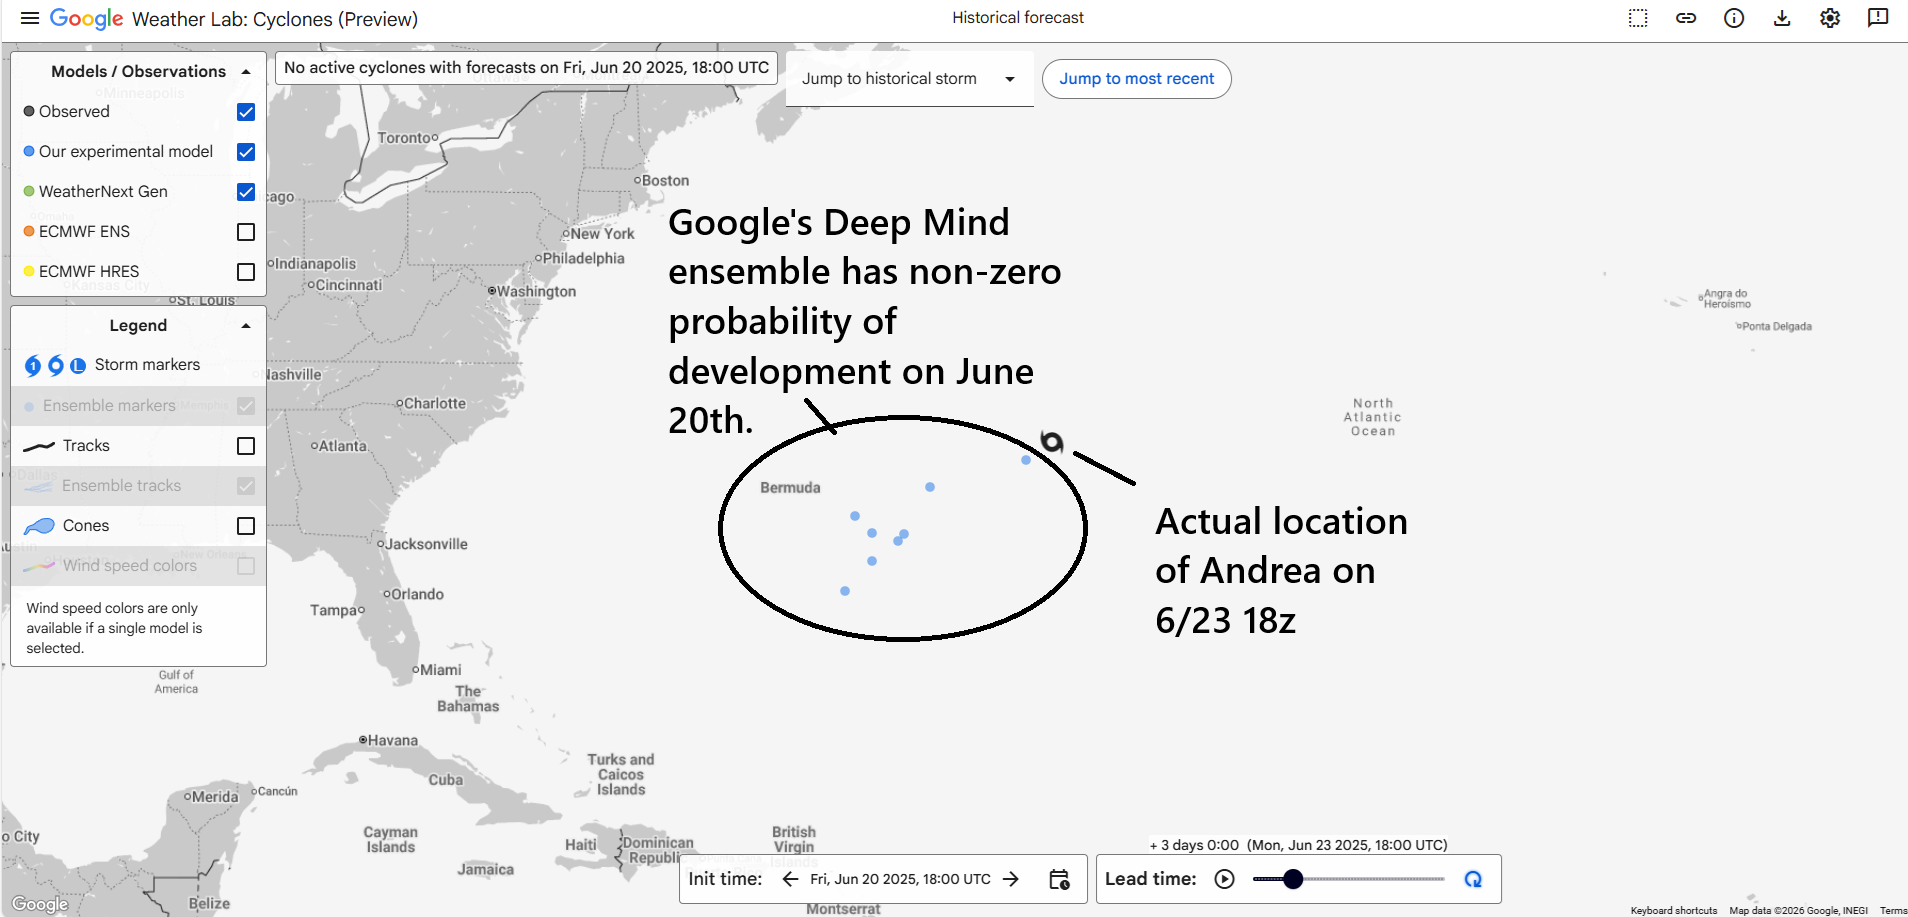
The first NHC genesis guidance in their daily tropical weather outlook updates had an 18-hour lead time. For an inconsequential, weak storm, the forecast outcomes here and in modeling were tolerable.
Tropical Storm Barry (June 28-30)
The second storm of the season was another short-lived affair. Barry will likely go down not for what it did but its indirect association with the catastrophic Guadalupe River and Central Texas flooding on July 4th weekend. According to the data provided in the NHC post-storm analysis, it’s clear that Barry was not the primary cause. The overarching pattern that may have helped produce Barry was the primary tropical contributor, of which Barry’s remnants were a slice of. You can see the precipitable water anomaly (or how much above normal atmospheric moisture was) from July 3-5, 2025 below, which shows a really broad trajectory of high moisture funneling into northern Mexico and the Southern Plains/Southwest.
Barry’s remnants were a piece of that puzzle but not the only piece of a complex, tragic event.
The system itself formed out of a disturbance that by the morning of June 27th was approaching the Yucatan. This was likely on the northern edge of a tropical wave, according to the post-storm analysis.
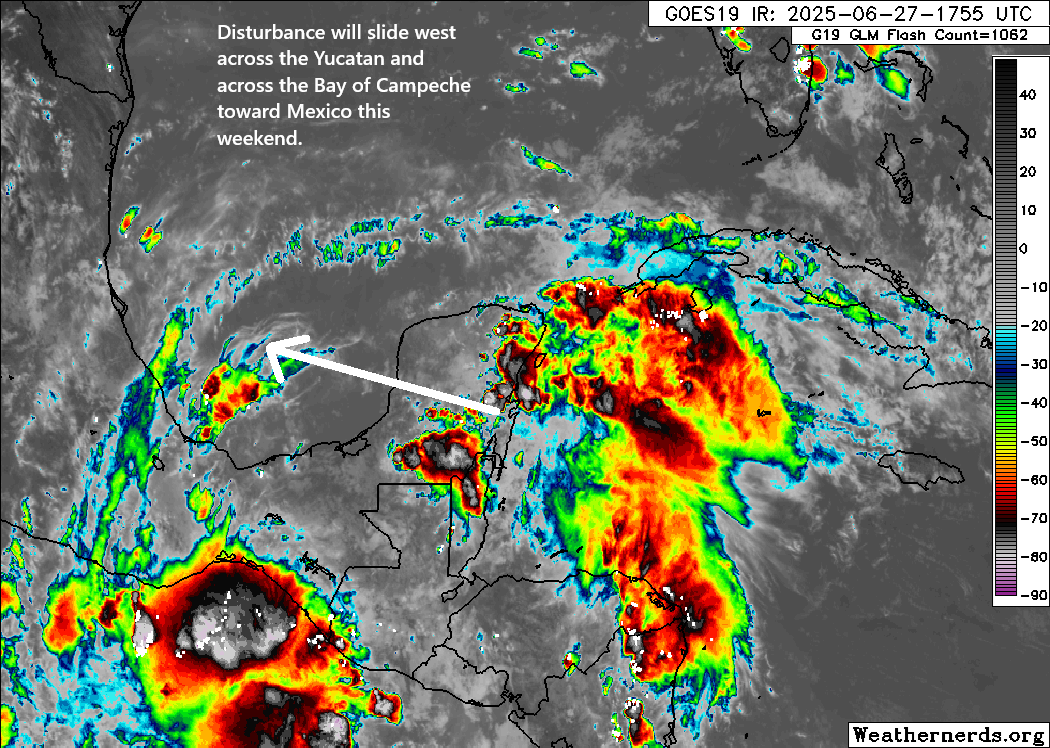
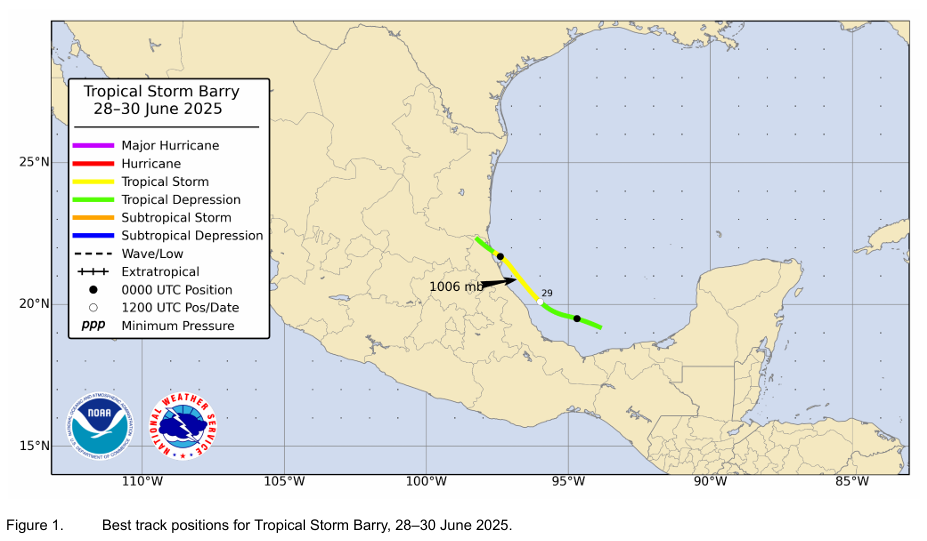
It went on to become classified as a tropical depression in the Bay of Campeche on Saturday the 28th. Barry formed from this the next morning, with maximum sustained winds peaking at 45 mph before it made landfall Sunday evening just south of Tampico, Mexico. In the post-storm analysis, it was determined that Barry had degraded into a tropical depression at landfall, with maximum sustained winds of 35 mph.

Barry sort of spawned with limited lead time. The first note on the NHC outlook came 42 hours before it formed.
Eight people in Mexico died as a direct result of Barry due to flooding or surf, and the storm caused about $5.6 million in damage. The highest reported rainfall from Barry was 17.99 inches (457 mm) at
San Gabriel, Tamaulipas in Mexico.
Tropical Storm Chantal (July 4-7)
Unlike Barry, Chantal was snuffed out by weather models several days in advance, with the first note on the NHC’s 7-day outlook happening on June 29th. There we even hints in the modeling several days prior to that, although struggles in the timing of Chantal’s formation led to sort of a last-minute adjustment to probabilities.

Chantal was an interesting case in that it formed from a dying cold front that stalled out in the northeast Gulf of Mexico and southwest Atlantic. Eventually, the disturbance itself formed in the Gulf and maneuvered into the Atlantic. A depression formed on July 4th from the thunderstorms.
About 16 hours after that image above, Chantal formed. Chantal began a counterclockwise pivot toward the Southeast coast under the steering currents, peaking at an intensity of 60 mph maximum sustained winds off the coast of Myrtle Beach before coming ashore as a 50 mph tropical storm near Litchfield Beach, SC late in the evening of July 5th. The maximum recorded winds on land were 47 mph sustained, with gusts to 56 mph at Springmaid Pier in Myrtle Beach.
Chantal will go down in the books for the flooding it helped spur in North Carolina. The maximum rainfall reported from the storm was 12.90 inches in Pittsboro, NC, just southwest of the Raleigh-Durham area. This led to record flooding on some rivers systems in the area.
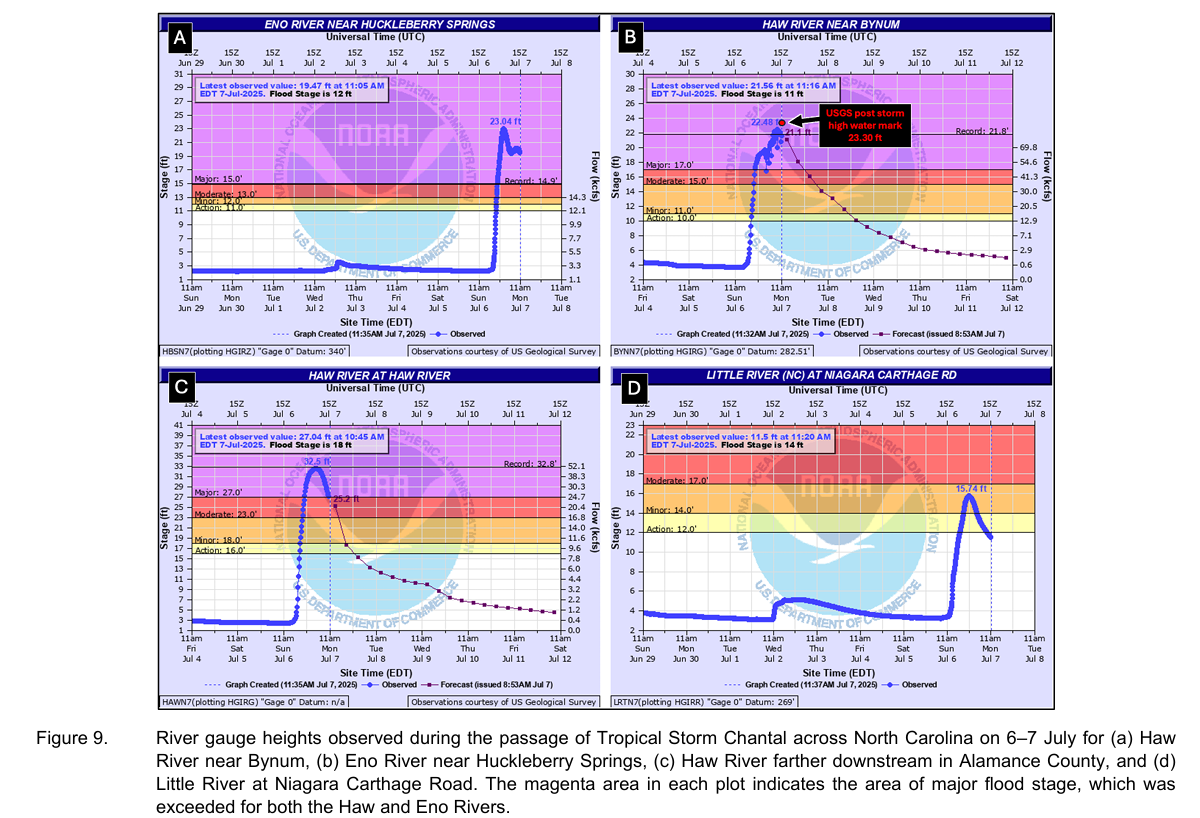
Many locations in eastern North Carolina saw 6 to 12 inches of rain, with lesser amounts in South Carolina. Chantal serves as another reminder that the inland flooding risk is sometimes worse than the storm itself.
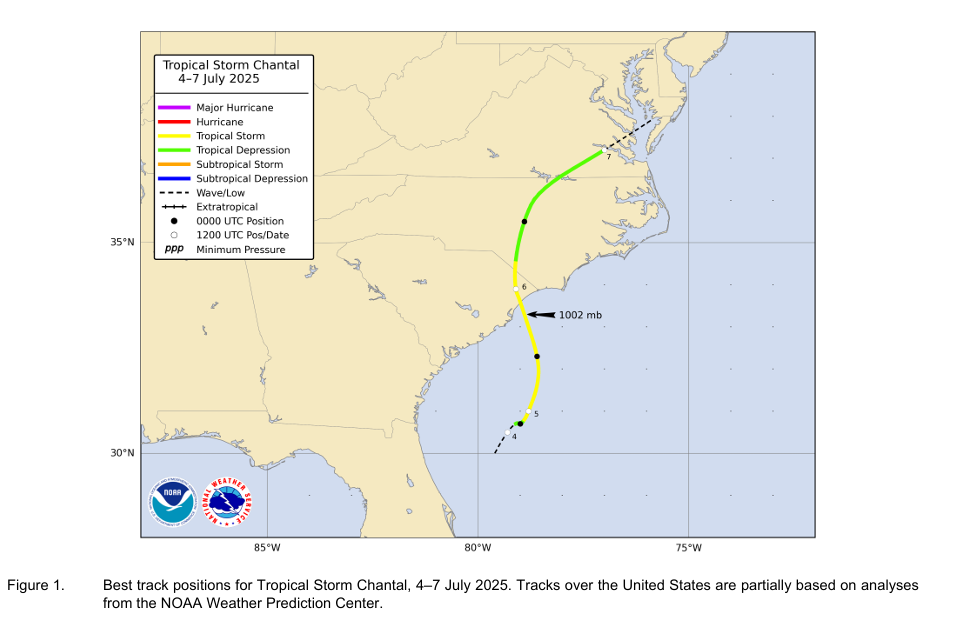
The NHC’s post-storm analysis has more imagery and pictures of the flooding and damage from Chantal. In the end, this was about a $500 million storm.
Tropical Storm Dexter (August 3-6)
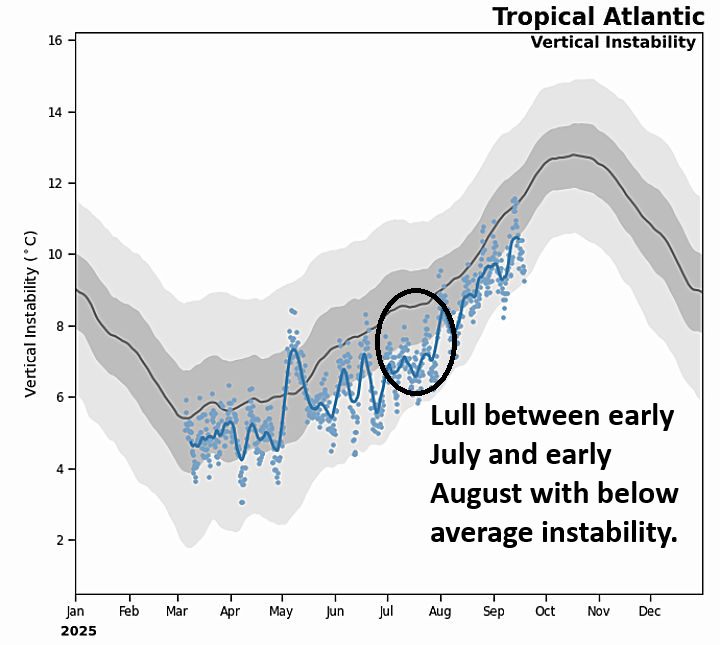
After Chantal, we went about 1 month between storms. Why was that? There was a good bit of atmospheric moisture available. Warm waters were aplenty. There are two theories I have. The first is reduced instability in the Atlantic during that time. In other words, we lacked the “juice” needed to generate thunderstorms, or at least it was below average.
Another reason, which is probably related, is that the background state of the atmosphere over the Atlantic Basin was hostile toward tropical development. If you look at a metric called “velocity potential,” you can see where the background state of the atmosphere shows rising air (better thunderstorm risks) or sinking air (less thunderstorm risk). The average anomaly from July 10 through August 5, 2025 is shown below. Cool colors indicate rising air in the background, warmer colors indicate sinking air.
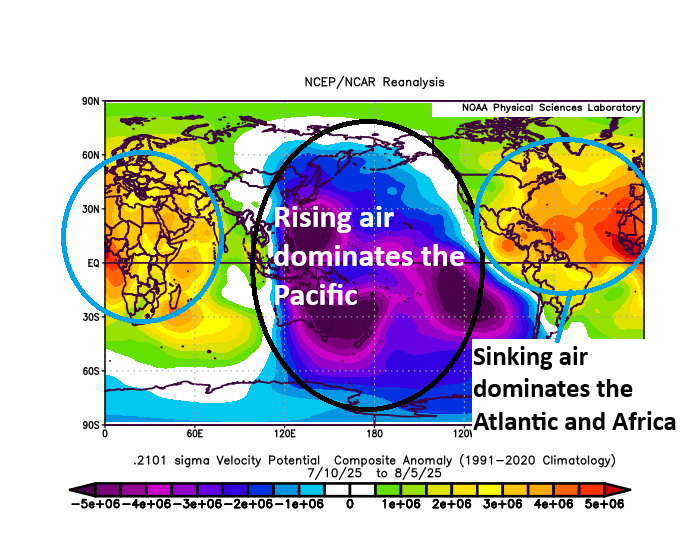
Velocity potential isn’t a make or break parameter. In other words, you can still generate tropical storms even with a hostile background state. But it does tilt the odds such that there may be somewhat less risk during those more hostile periods. Like everything, it’s nuanced. We discussed this a bit around July 10th. This idea seems to have been validated by models overforecasting the return of rising air to the background state of the Atlantic, while simultaneously generating some disturbances in the extended forecast timeframe in July that never actually came to fruition in any meaningful way.
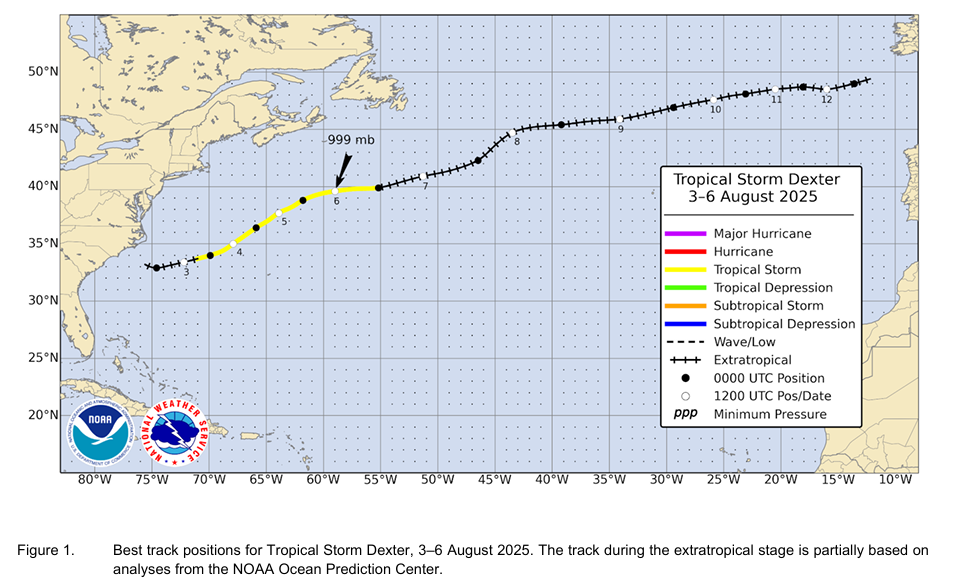
In any event, Dexter formed off a stalled front in the western Atlantic around August 2nd. It became a cyclone about 375 miles west northwest of Bermuda. Dexter peaked on August 6th as a 60 mph tropical storm before becoming an extratropical storm that night. It did reach hurricane-force with winds as an extratropical storm but was not considered a hurricane by definition. Dexter sort of came about fairly quickly with generally mediocre genesis forecasts. But once identified, the models did fine with its forecast.
Dexter was mostly a non-event, as it remained out at sea.
We’ll pick up the action in Part 2 of our season in review.