One-sentence summary
With a powerful storm hammering California today, we take a look at why California is targeted so often during El Niño winters and a quick look at what’s to come after this week.
California Streaming
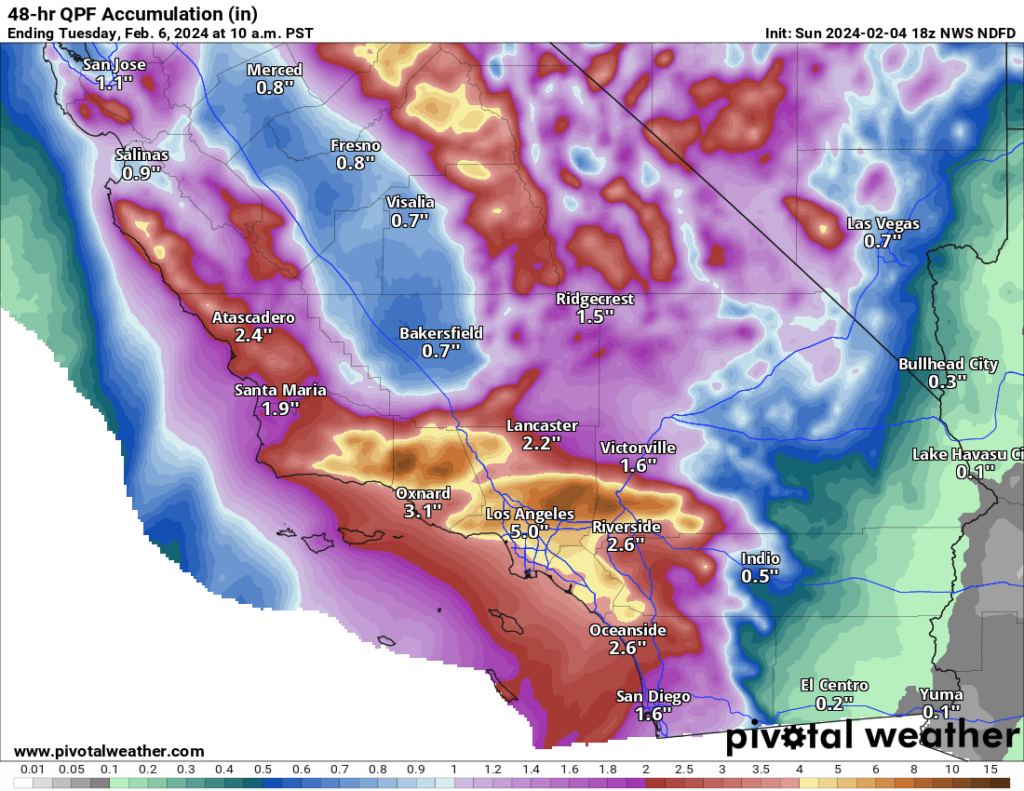
One of the biggest storms in years is impacting portions of California. Rain totals are expected to be in the double digits in a few places, with upwards of 5 more inches of water coming to LA and 1 to 4 inches or more up and down the coast from the Bay Area through San Diego.
This has led to two days worth of high risks from the Weather Prediction Center for excessive rainfall. High risks are uncommon, and they are historically very well correlated to flood damage. Over 80 percent of flood-related damage and nearly 40 percent of flood-related fatalities occur on high risk days.
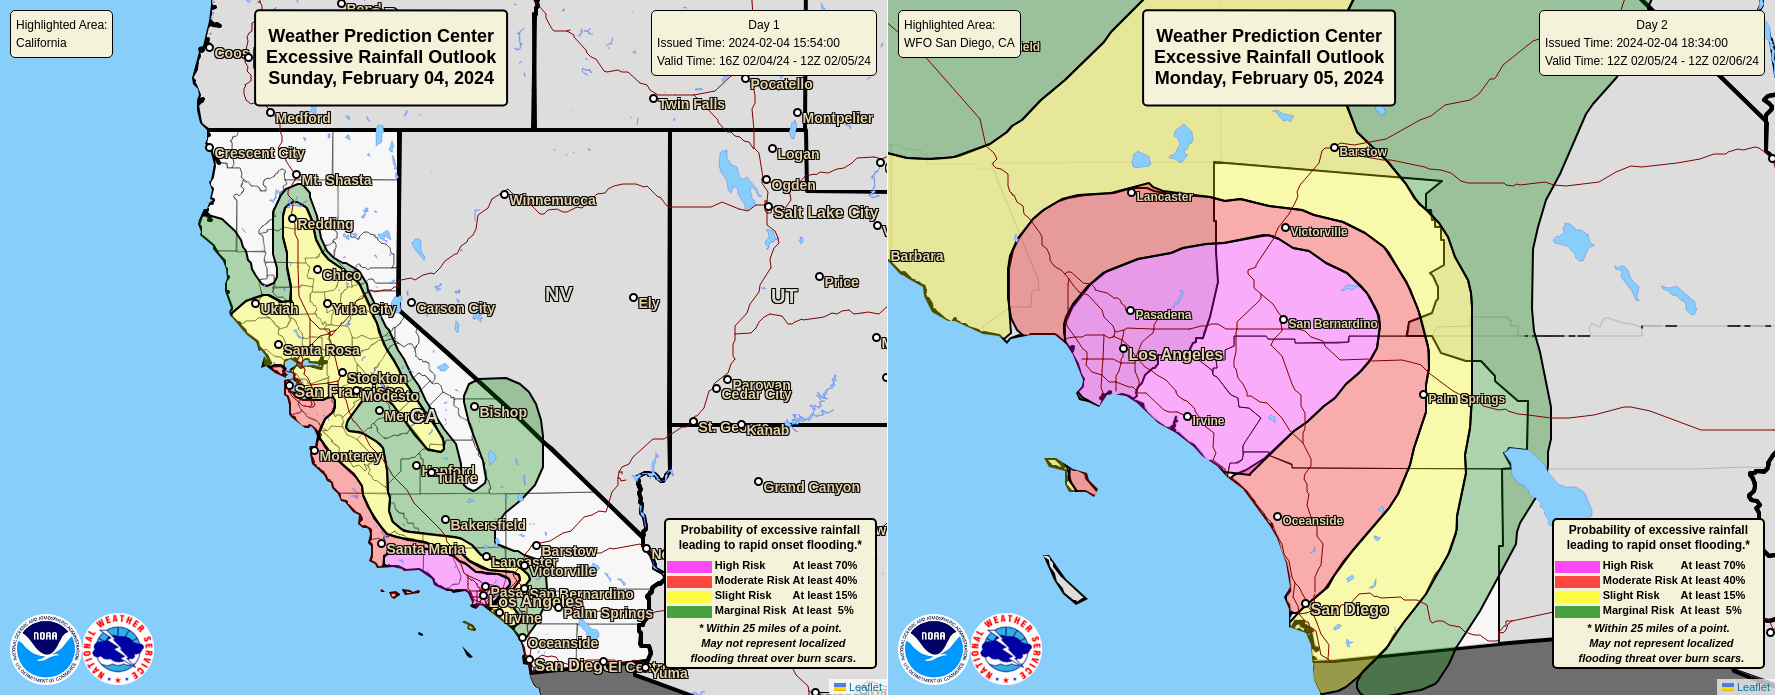
Seeing back to back high risks in California is certainly impressive. Translation: Take all warnings seriously.
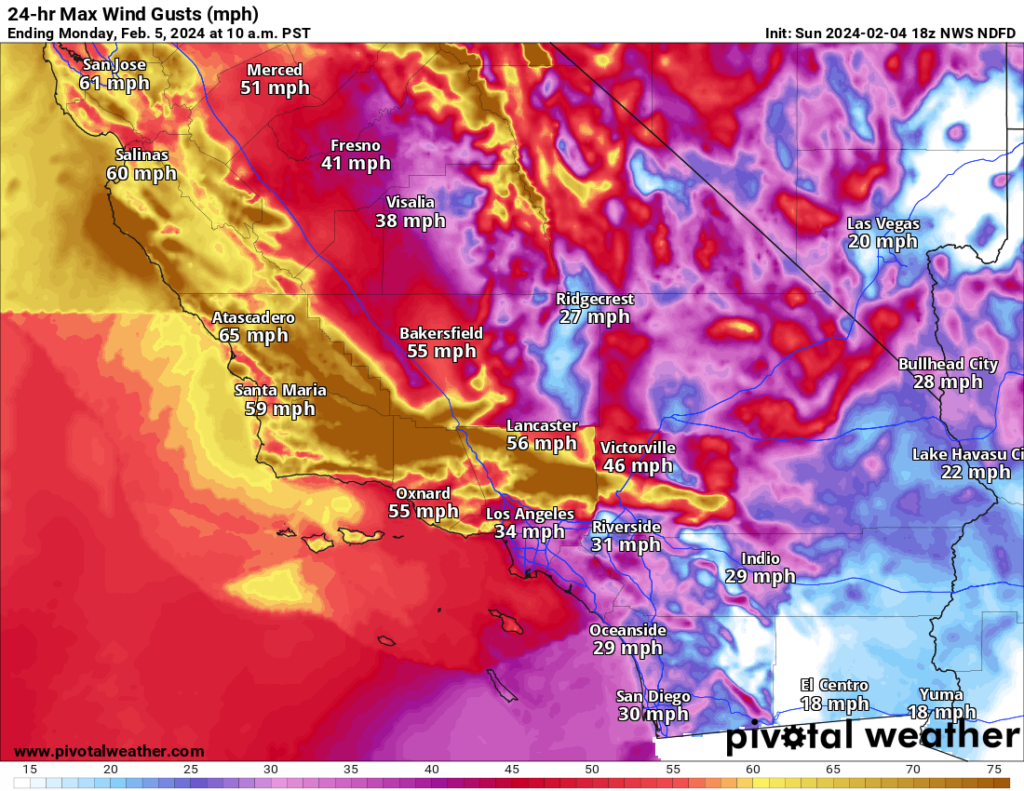
In addition, powerful winds are impacting the Central Coast, Bay Area, portions of SoCal, and in the mountains. Wind gusts are expected to top 60 mph, and in fact the NWS actually issued a hurricane-force wind warning offshore of California for the first time in this region. The wind should begin to ease up a bit heading into tomorrow.
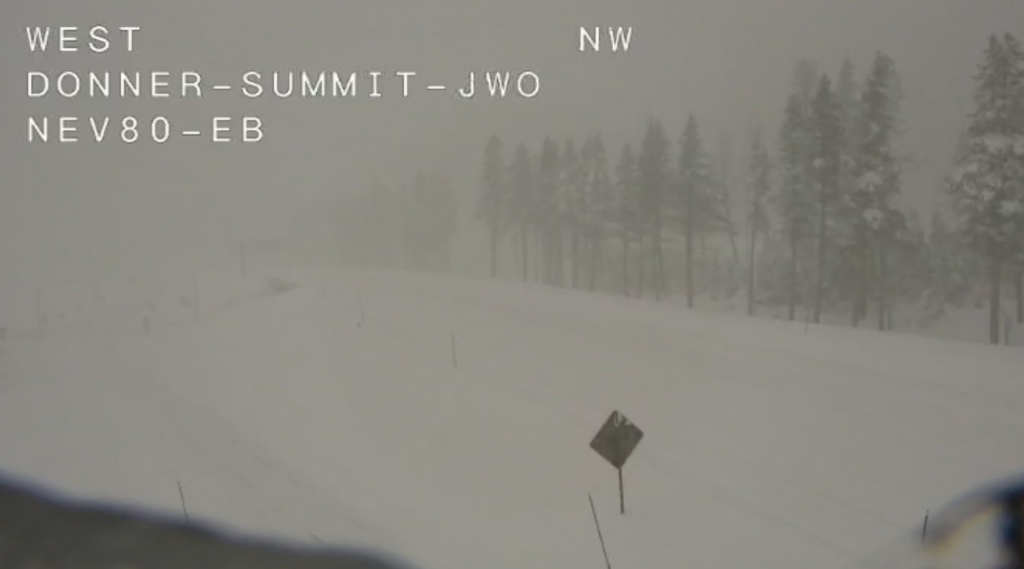
Lest we forget, the winter weather impacts from this storm will also be big. The Sierra will see upwards of 1 to 3 feet of snow, wind, and risk of avalanches.
Additional moisture will continue to move through California and the West into midweek, but it should be a less impactful than what is currently ongoing.
Why California?
When you think of El Niño, many of you will think of Chris Farley or weak hurricane seasons or warm Pacific Ocean water. All three, while nuanced are correct thoughts to have. You may also think of rain in California. If you’re a student of the 90s (raises hand), you may remember the 1997-98 El Niño, which at that time was one of the strongest on record. So why does California tend to be stormy during stronger El Niño events, such as the one we have ongoing in 2024?
If you look at a comparison of the 30-year average of jet stream zonal winds side by side with just El Niño years from December through March in the higher end El Niño events since the 1960s, you get a few interesting things that stick out.
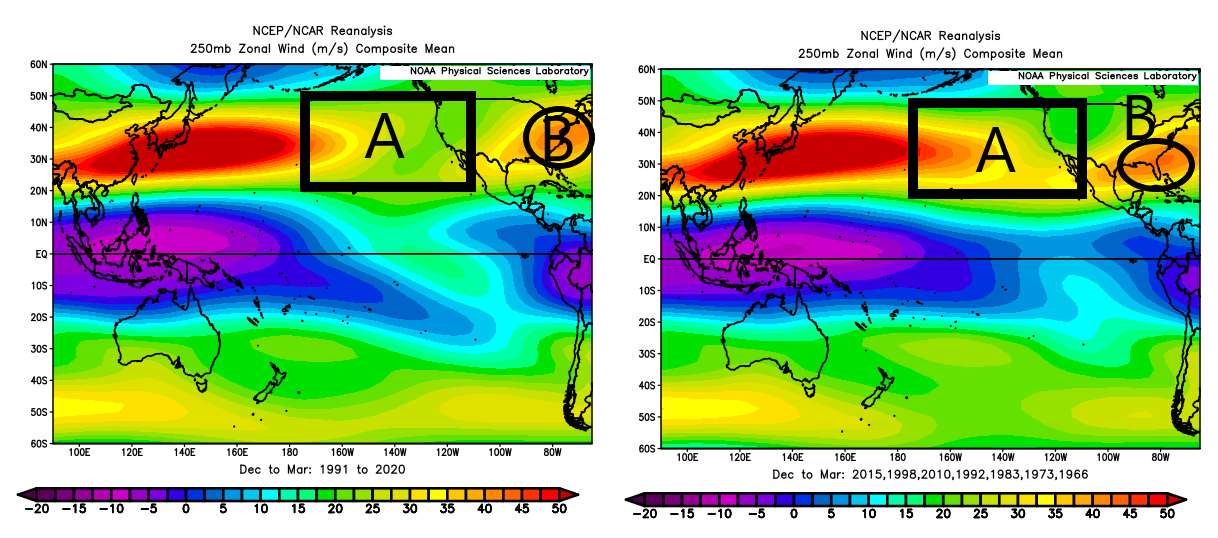
In the area I’ve labeled “A,” you can see that the map on the right has stronger winds farther east than in the map on the left. What does this mean? We usually see a stronger jet stream extended across the Pacific during El Niño winters, which points it more often at the southern half of California or northern Mexico. For the area labeled “B,” you can see that in the map on the left, the peak of that portion of the jet stream is centered more over the Mid-Atlantic. The map on the right shows that more over Florida or the Southeast. Basically, the jet stream aims south more often. And historically, you’ve ended up with a wetter southern tier of the United States from California to Texas to Florida.
Essentially what happens is that as the water of the Pacific Ocean warms in the Equatorial region, you force typical features to displace relative to normal. This shakes up the landscape, including that shift and intensification of the jet stream. Not every El Niño is created equal, even the strong ones. The 2015-16 El Niño was a bust in SoCal in terms of rainfall, but the following year was pretty wild, especially in NorCal.
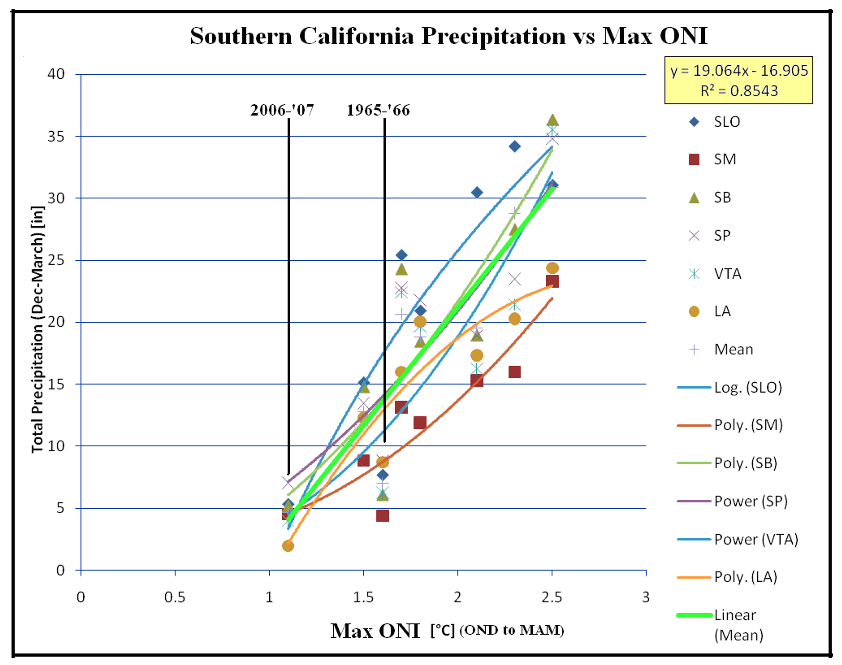
But in general, the relationship does hold up historically. A strong El Niño usually produces a wetter SoCal. Things are a little more muddled in the northern part of California. And notably, when you consider flood damage, things get more confusing, with only four of the top 13 most damaging winters in terms of flooding in all of California occurring during El Niño years according to Jan Null of Golden Gate Weather Services.
So all in all, while this storm is particularly intense, it basically fits the overarching narrative of an El Niño winter in California.
The storm train should calm down some in California after this week, with the jet stream aiming a bit farther south more into Mexico and deep south Texas and Florida.
It’s not unheard of for a rebound of storminess to occur in California into March or even April in years like this, so I doubt we’re done yet. But it will be good to hopefully have some time to dry out a bit between storms there.
Thank you so much for your explanations!
You are appreciated!!!
The Grammys tonight should be fun in the rain
This was a very clear and educational article on el Niño. Thank you for taking the time to explain it to us.
Great stuff, Matt! I always learn so much here!! 🤗
🌬 ⚘ ⚘⚘
California and that area is truly receiving a blessing. I hope they can store most of that rain or at the very least, begin building more reservoirs for the next Niño. Next week, there will likely be articles on how California is STILL NOT drought free. They should instead run articles on why resources go elsewhere and not on capturing and storing water. .02
Thanks Matt for your explanations of the weather “why’s” it helps to understand patterns better. We’ve just recently relocated to SWFL from the West Coast, and we’re learning a whole different pattern, and indicators. Our first Fall had a Cat 5 Hurricane (Ian) 😜. We got turned onto your page from a friend in Houston who follows you. We love the “No Drama, Just Facts” aspect to your page. Keep up the good work!! ✌🏼
Thanks, Jerry! Glad we can be here for y’all!