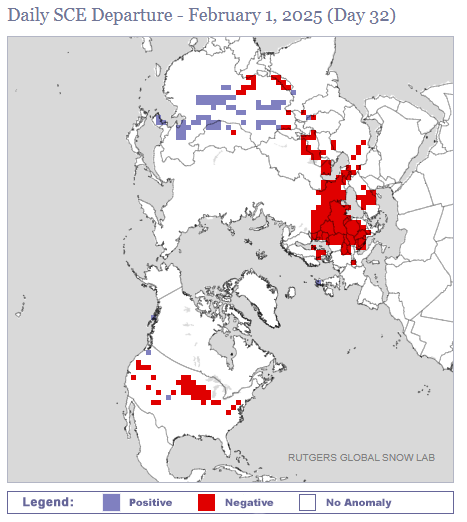
Those are the approximate snowfall departures from normal this season as of Sunday for Minneapolis, Chicago, New York City, and Concord, NH. Much of the country is in a bit of a snow deficit right now, as evidenced by the snow cover departure map below from the Rutgers Global Snow Lab.
Snowfall anomalies are negative (below average snow) across much of the country right now. (Rutgers Global Snow Lab)
It’s been so bad that as of February 2nd, Chicago and Minneapolis both have only about an inch more of snow on the season than does Pensacola, FL. While this speaks more to the lack of snow up north than the surprise snow down south, it’s still a bit of a shock.
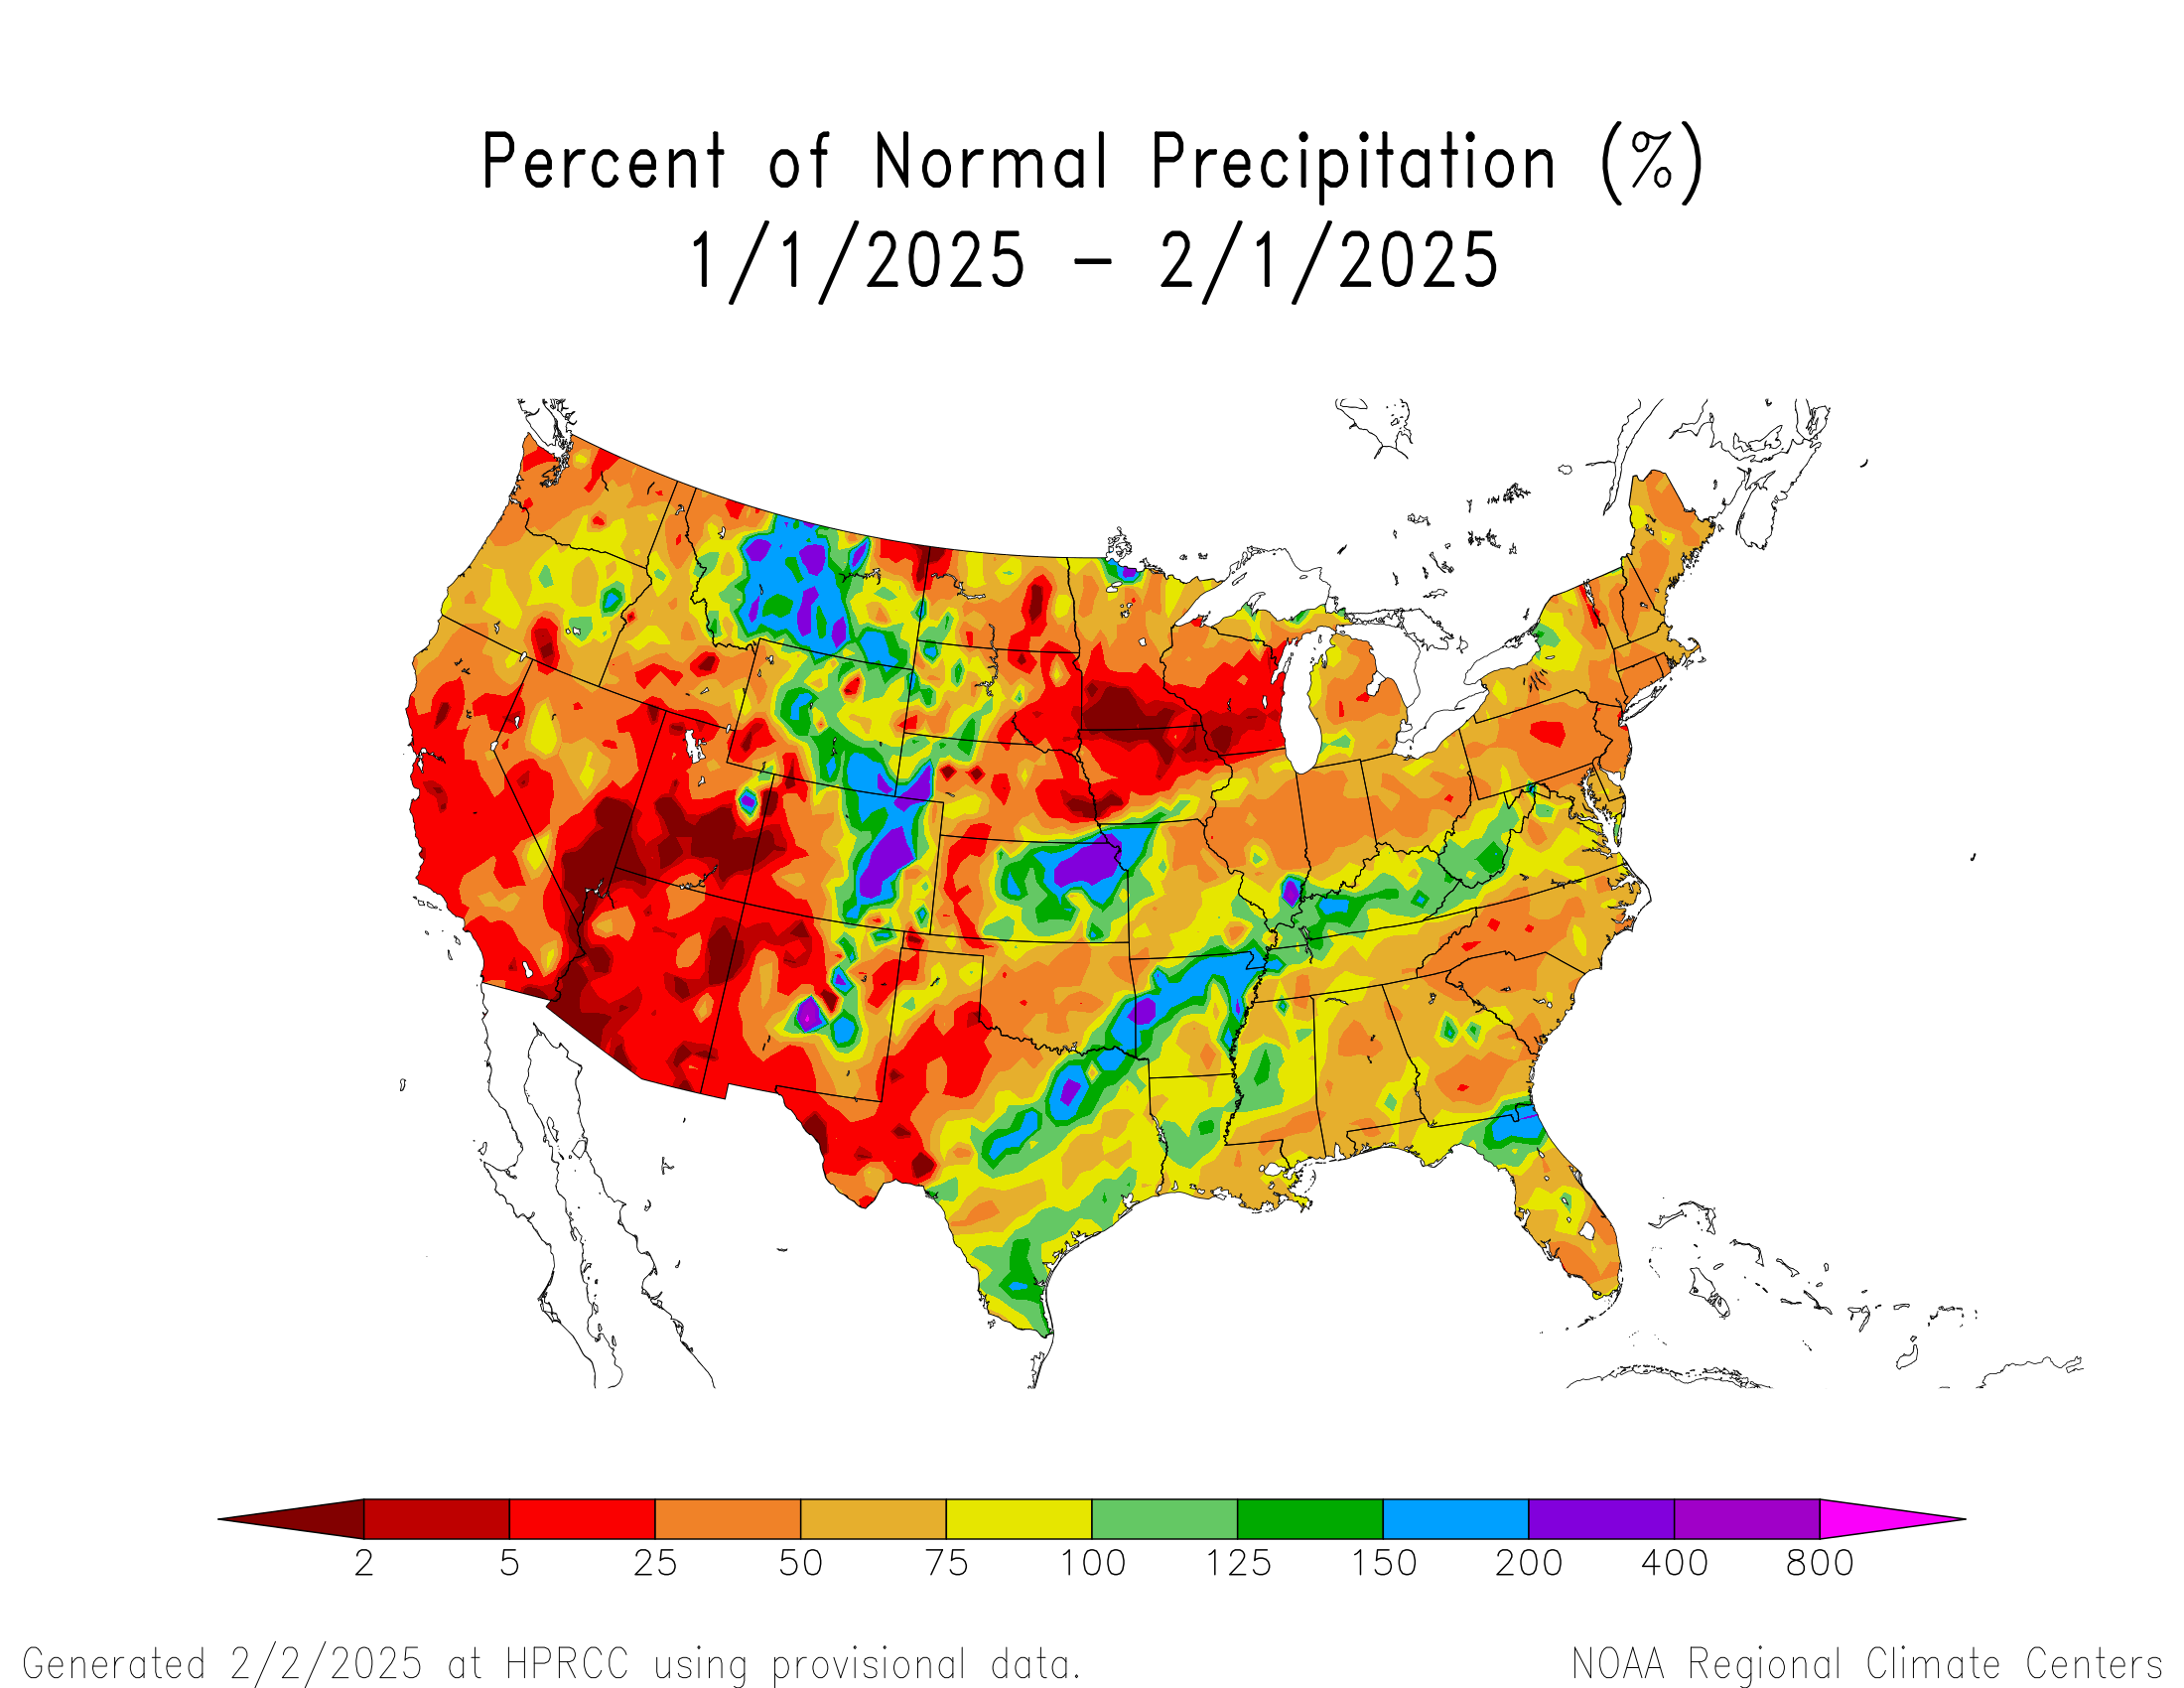
If you look at how January finished in terms of precipitation (not just snow, but all forms of precip), most of the country ended up drier than normal, taking the whole “Dry January” thing a little too far.
Total precipitation has been below normal except in the Rockies and parts of the Plains and Ohio Valley for the most part so far in 2025. (High Plains Regional Climate Center)
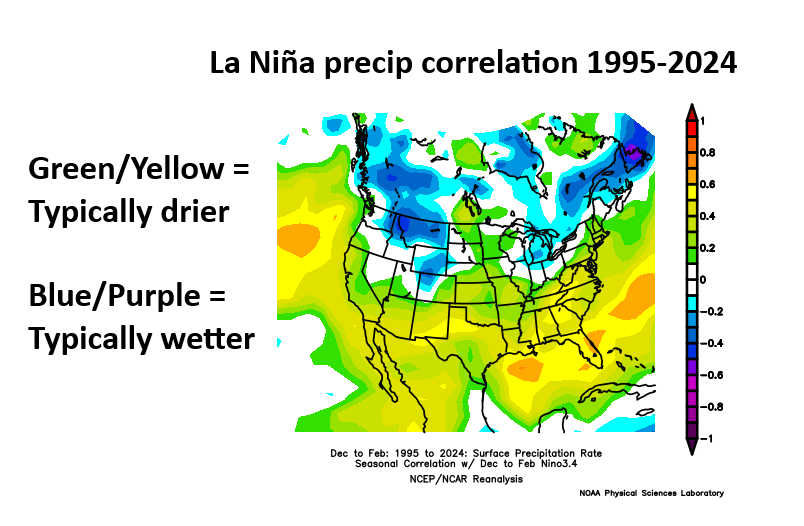
Last week we discussed La Niña and how it finally became established in December. It’s not uncommon for La Niña to generally produce drier than normal weather across the United States. So in theory, this makes sense.
A typical La Niña since 1995 would be drier than normal across much of the country, with the exception of the Great Lakes and Rockies. (NOAA PSL)
The conventional wisdom is typically that SoCal through Texas and Florida are usually dry in La Niña, but over the previous 30 years, the signal for dry does extend to cover much of the country. It surely does not guarantee dry weather, but it tends to skew the odds in that direction.
So, here we are, after a drier than normal January and with snow departures racking up all over. At some point it changes, right? It can. Usually as we transition toward spring, the stronger dry signals we see above start to break down more to “coin toss” territory. But what about in the shorter-term? Well, that brings us to the models.
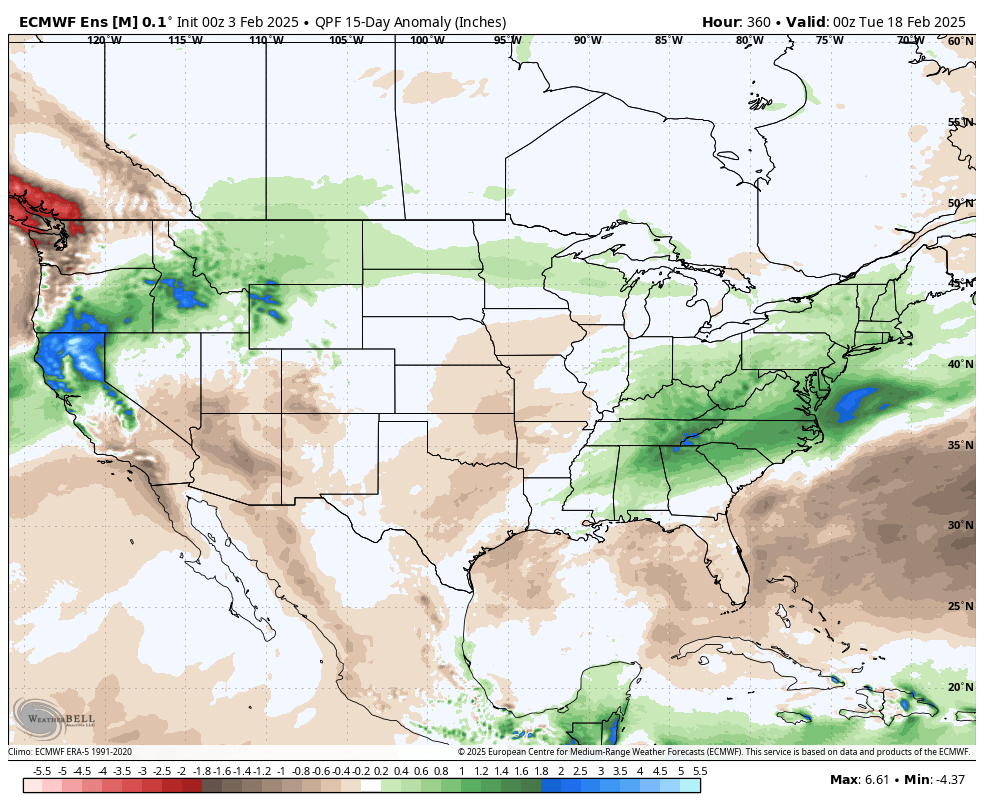
Forecast precipitation anomalies over the next 2 weeks, show a wetter than average eastern U.S., northern Rockies, and northern California. (Weather Bell)
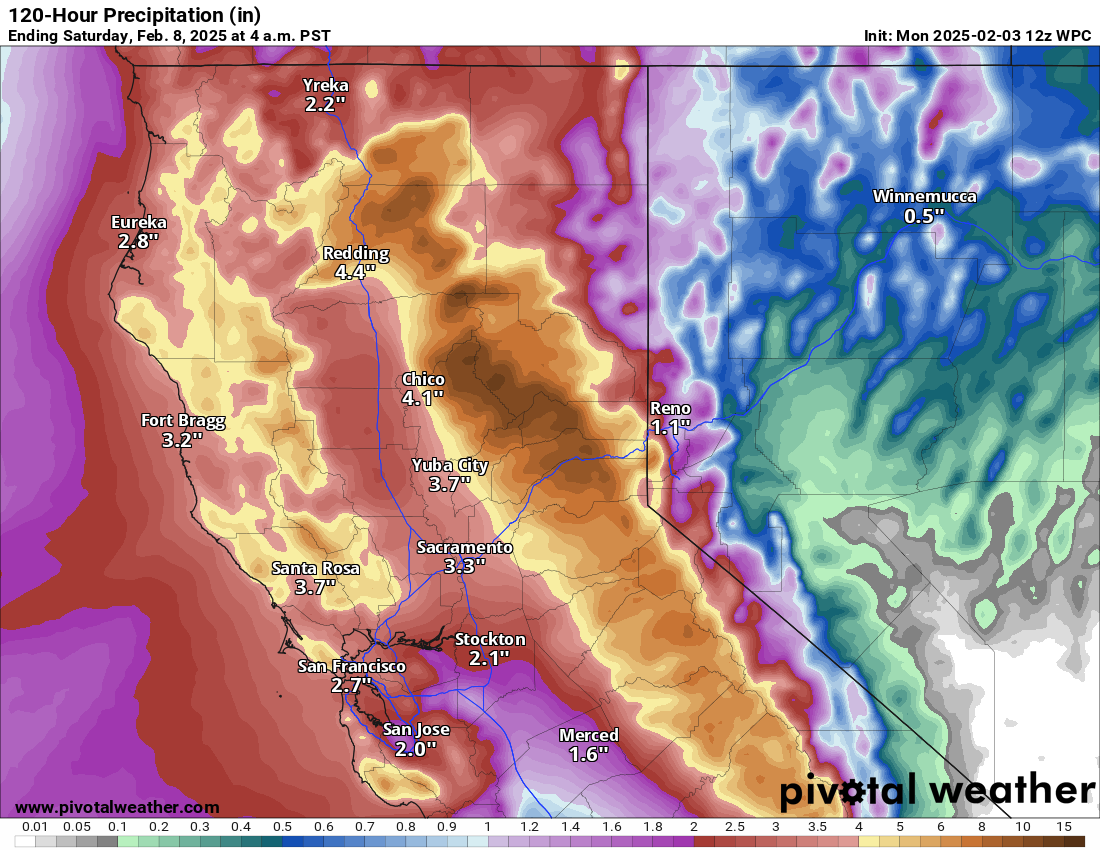
Over the next couple weeks, there are signs at least that a series of storms may cross the middle of the country. In my experience, when you have the type of clobbering we’re seeing in California right now, that usually produces something downstream. Over the next 5 days, northern California will indeed continue to cash in from an ongoing atmospheric river event with anywhere from 6 to 10 inches of liquid equivalent precipitation in the mountains. This should boost snowpack, which is running at a deficit this season.
Precipitation over the next 5 days in California will help the Sierra snowpack situation. (Pivotal Weather)
But notice on that Euro map a couple images up. There is definitely a signal of some sort change in the precipitation pattern we have seen thus far in 2025. Yes, the northern Rockies still look to cash in, but so will the Northeast, Mid-Atlantic, and Tennessee and Ohio Valleys. As well as the area near and north of the Great Basin. The question for folks east of the Rockies would be: Will it snow? And the answer appears to be “maybe?”
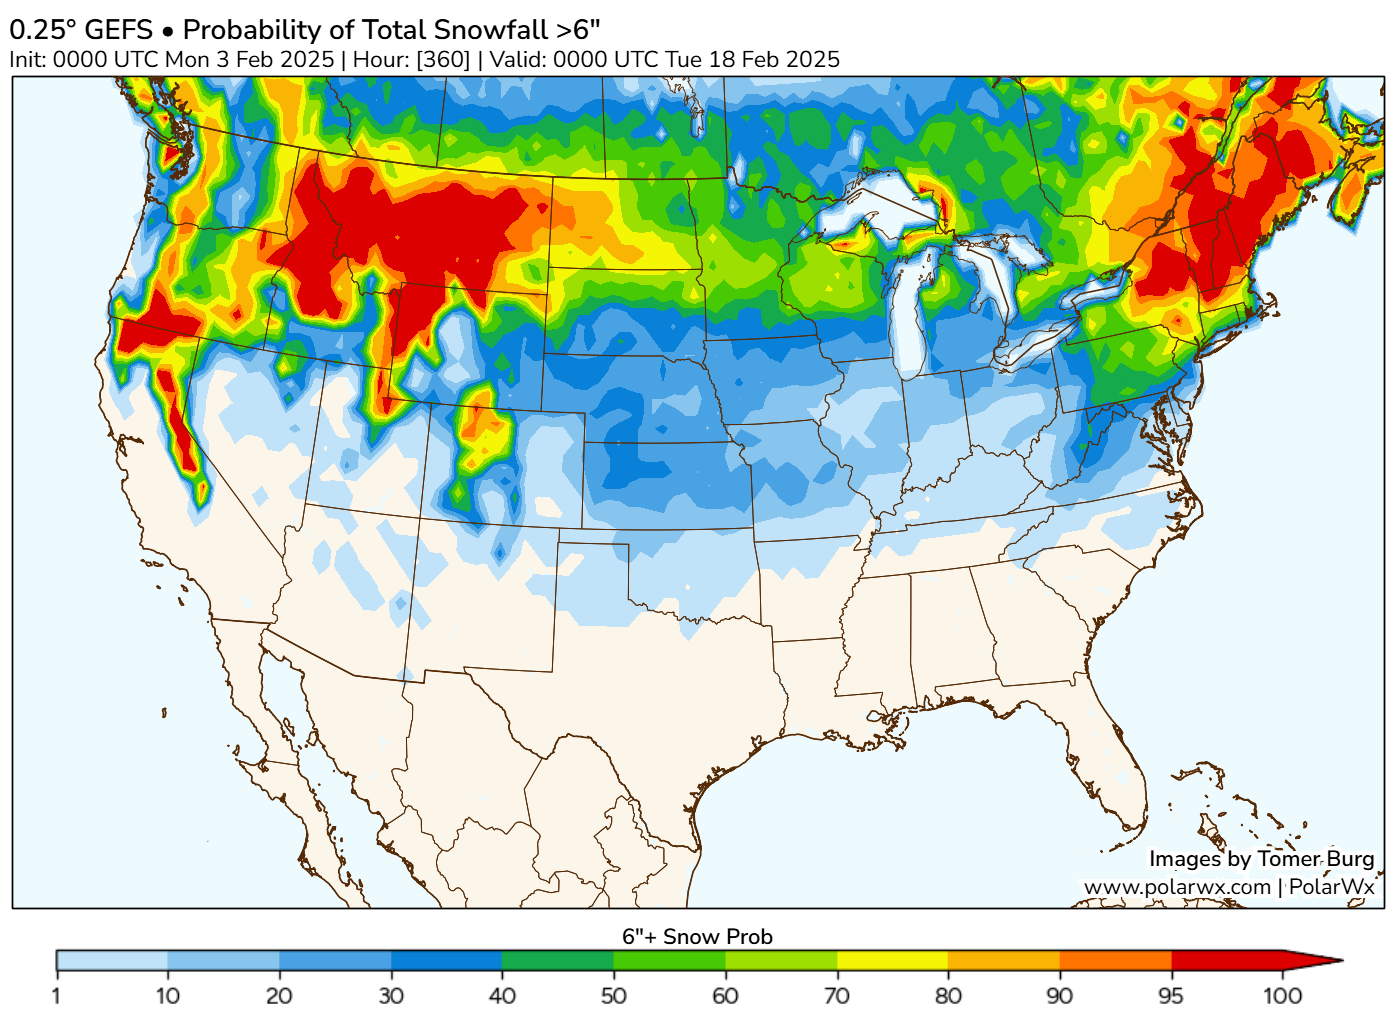
GFS Ensemble probability of 6 inches or more of snow over the next 2 weeks. (PolarWx.com)
The map above shows the probability of 6 or more inches of snow over the next 15 days. And indeed some areas that have been experiencing a bit of a “snow drought” so far this winter may see some ability to cash in now. How this unfolds? It will come in waves. We’ll likely see a somewhat significant storm later this week, followed perhaps by another one this weekend and yet another storm or two next week, along with perhaps some colder air in the mix. While the details are far from clear at this point, the take home message is that we may be seeing a bit of a change in the pattern to help snow lovers out in spots. Not everywhere but that may be the best we can hope for in a winter like this.
After a respite, cold weather may try to re-emerge in mid-February in the eastern two-thirds of the United States.
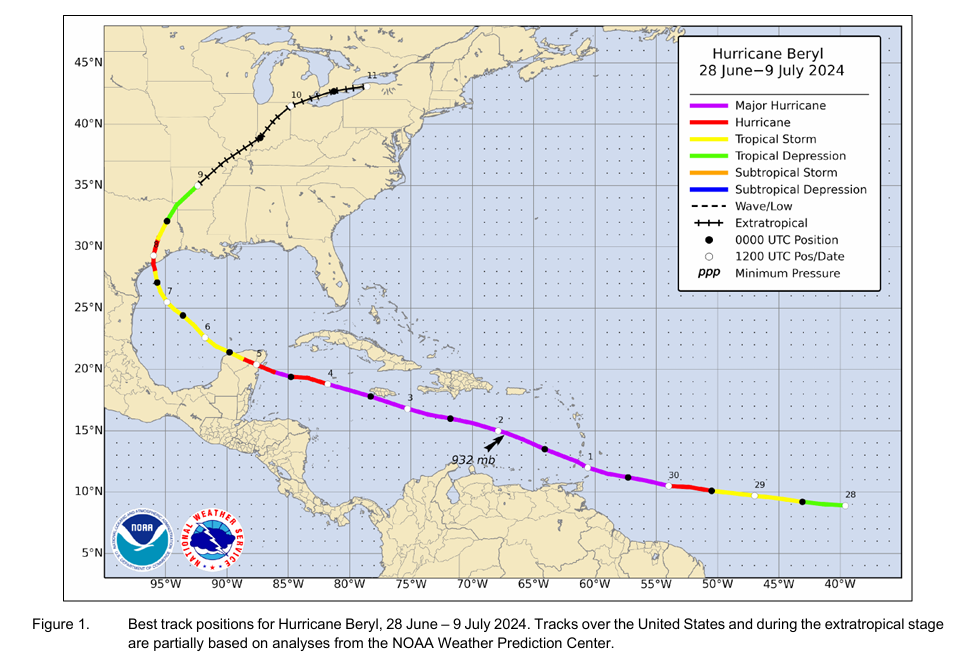
Hurricane Beryl’s post-season report was issued last week, and we got a few new nuggets of data to digest.
La Niña became official in December, but what happens as we head toward summer may be in coin toss territory right now.
Winter may give it another go for the Midwest & East
Things are generally quiet in the weather space, or at least there are no real extreme impact events to discuss right now. That’s good at least. So let’s discuss the winter situation.
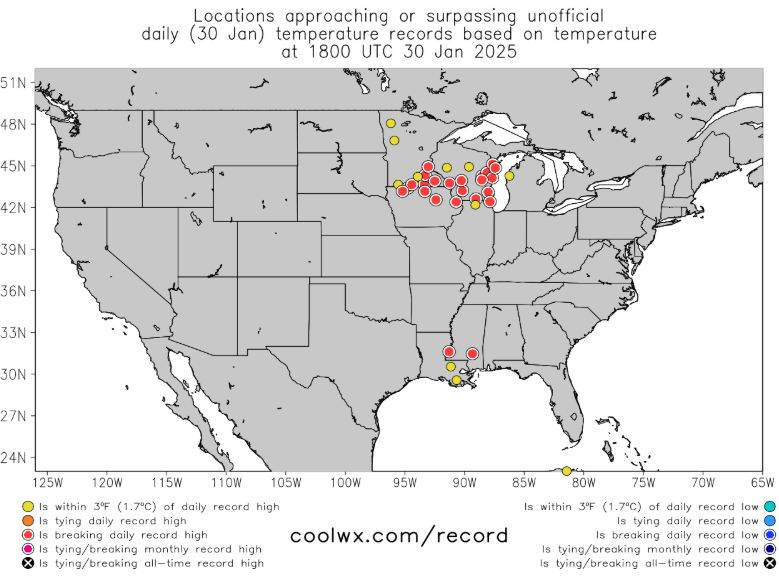
Numerous locations in the Upper Midwest saw temperatures break records today.
Record highs being set in red all over the Upper Midwest on Thursday. (Coolwx.com)
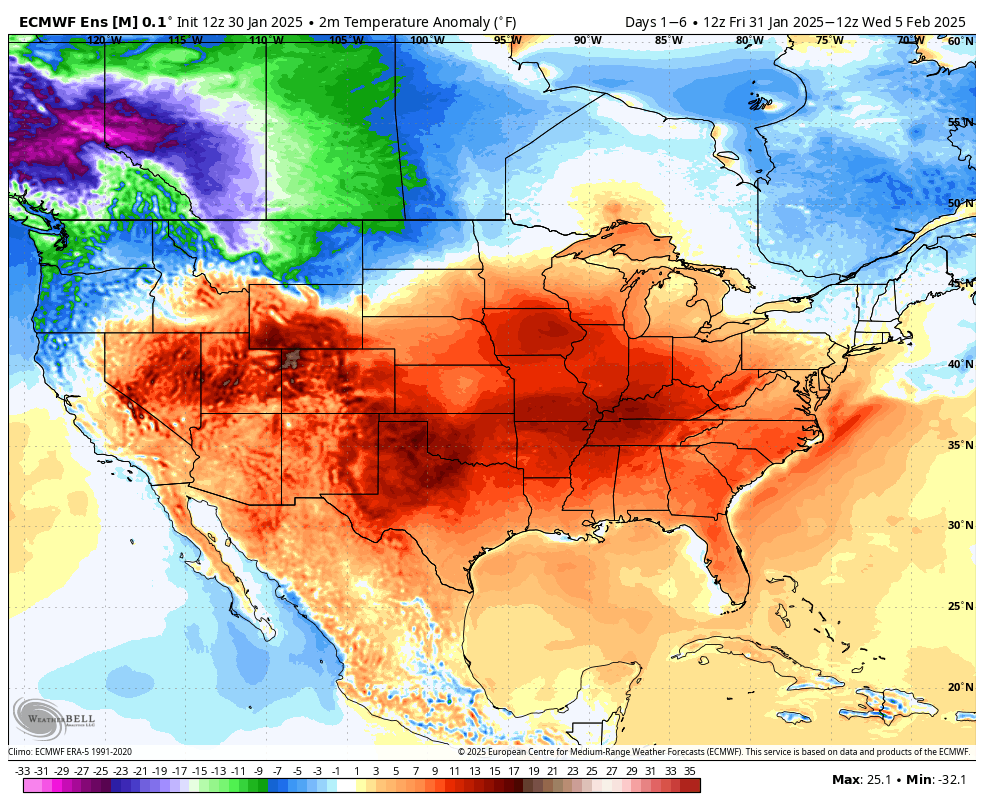
Since last week’s cold, much of the country has shifted back to warmer than normal weather this week. The exception to this is in the interior West. Over the next 5 or so days, this warm pattern is expected to continue.
Average temperature anomalies from Friday through Wednesday morning. (Weather Bell)
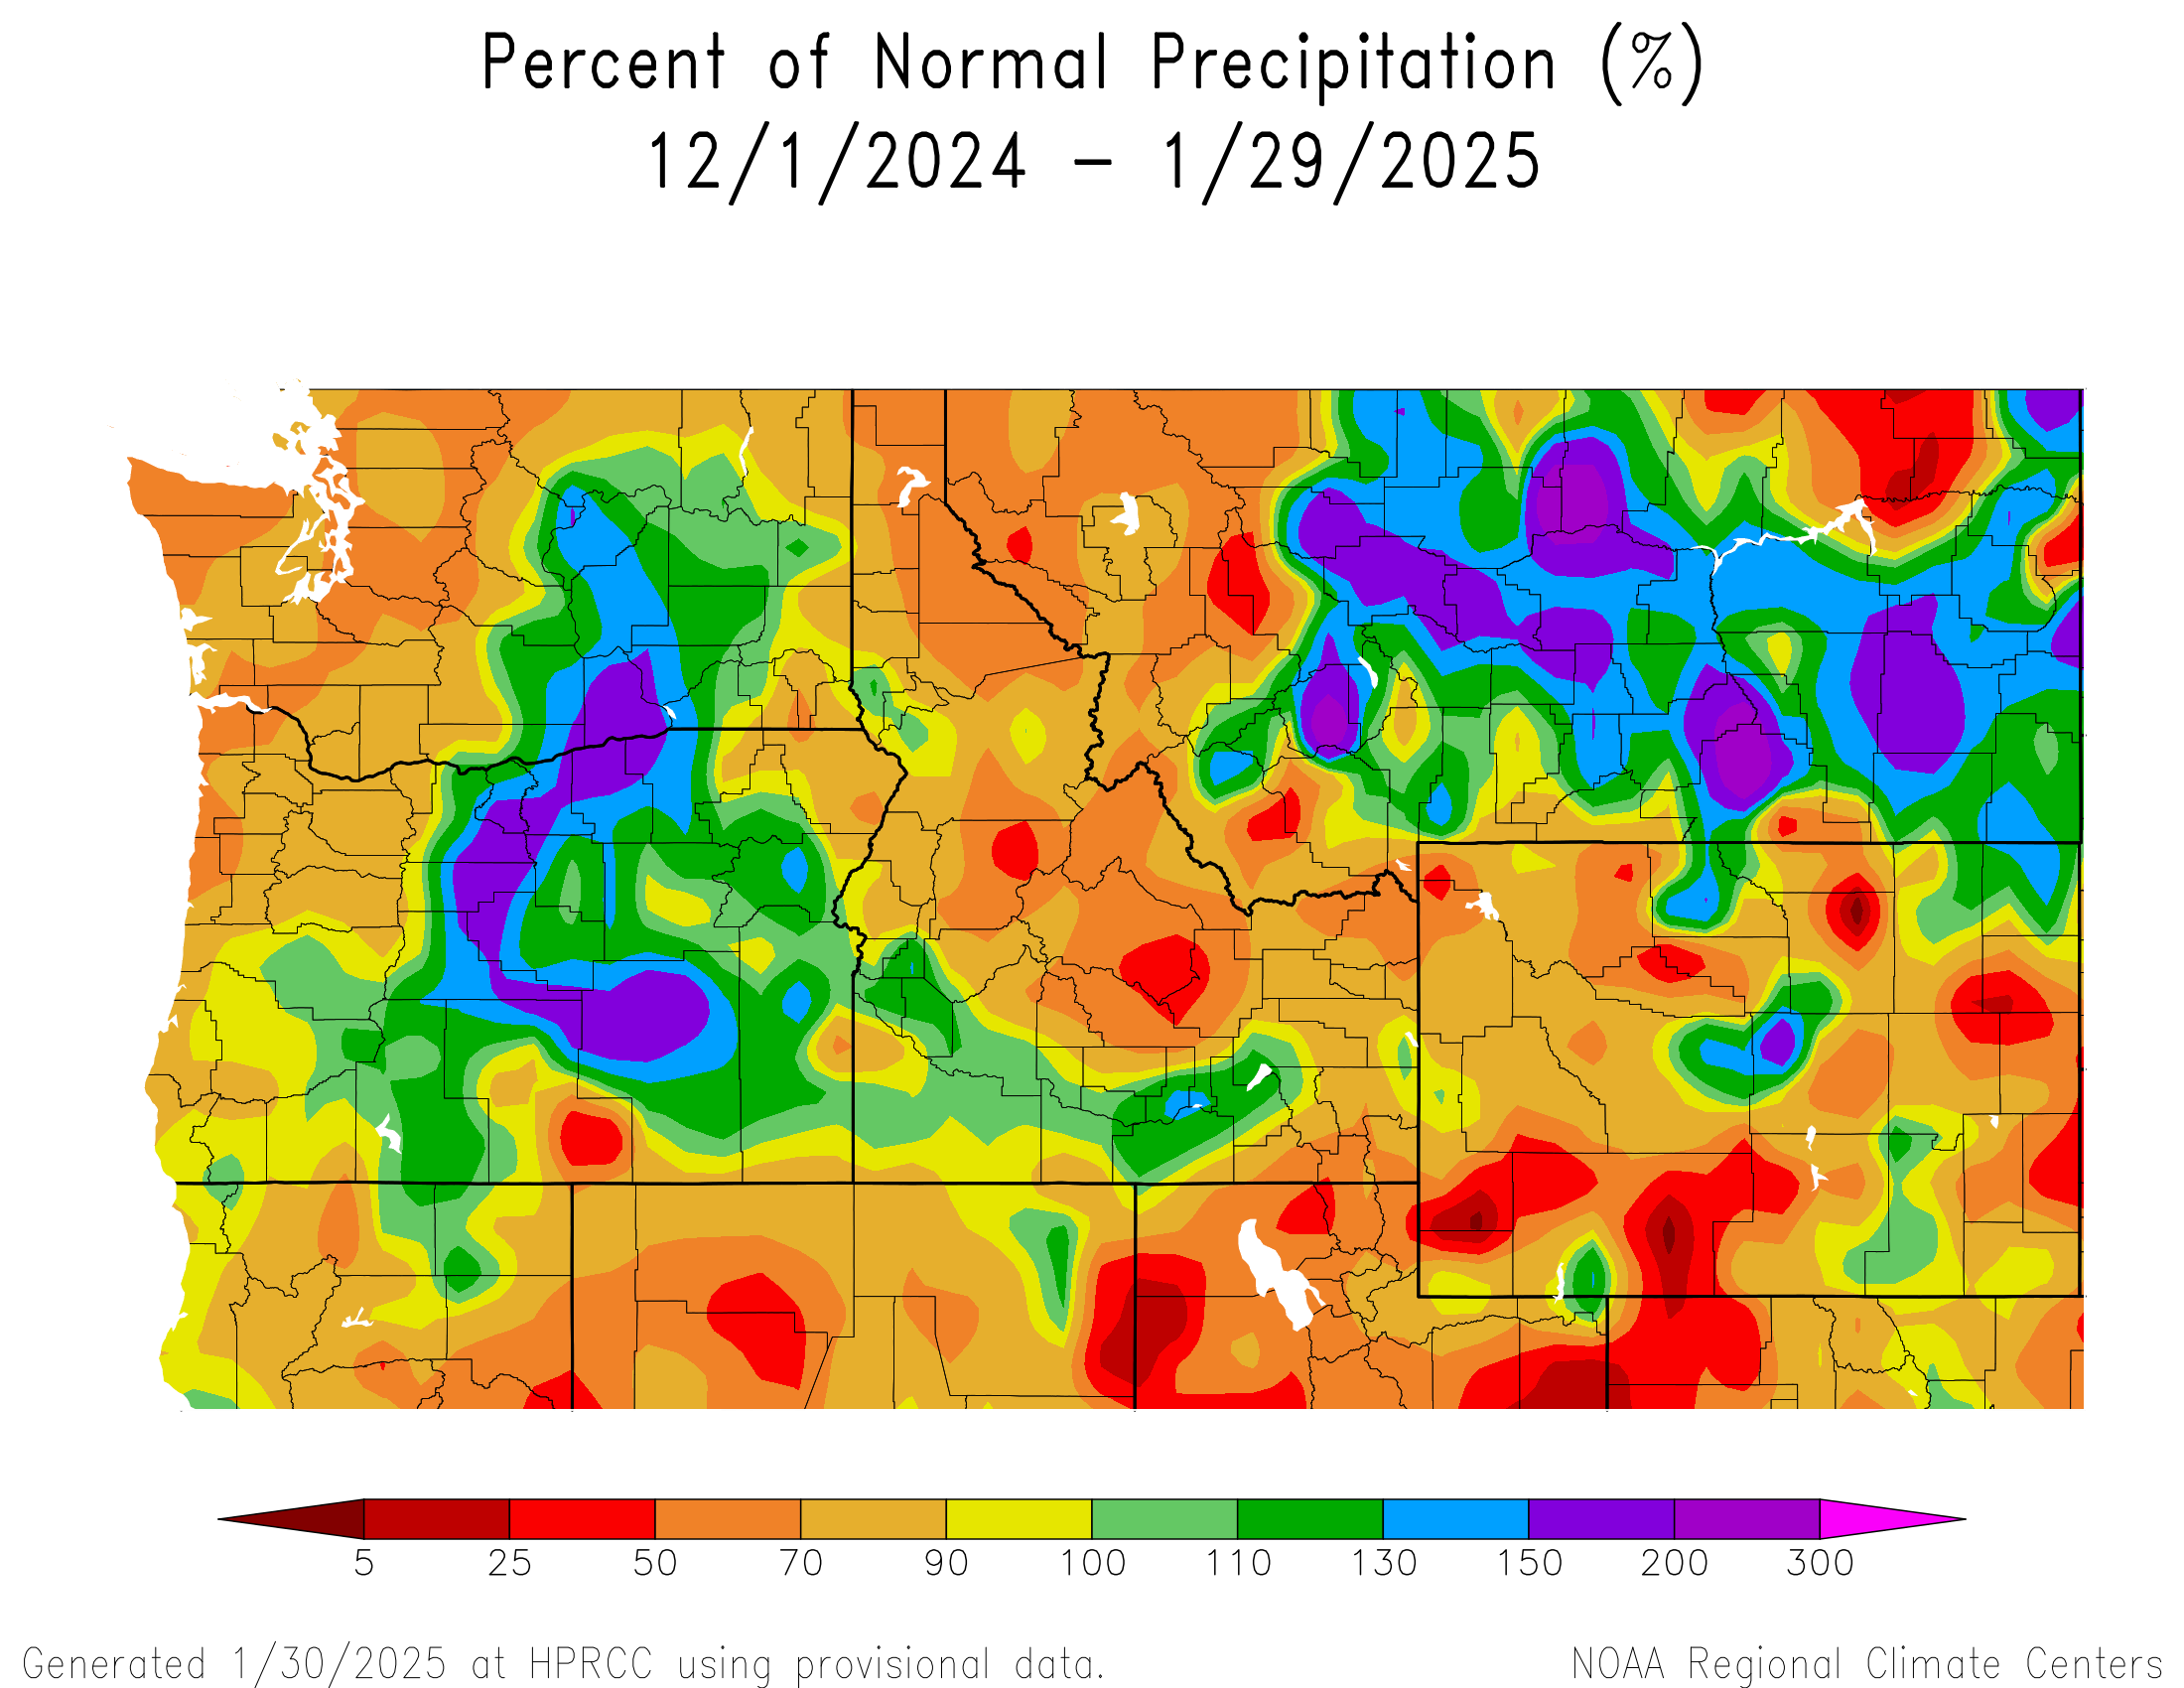
The Northwest will begin to see some stronger cold and also some solid mountain snow. This is an area that has had some very mixed results over the last couple months in the precip department. Portions of Oregon have done great, while much of Idaho, the Cascades and portions of the interior West have done not so great.
The last two months of precipitation as a percent of normal have shown Oregon doing well, in addition to Montana. Other locations have been less fortunate. (High Plains Regional Climate Center)
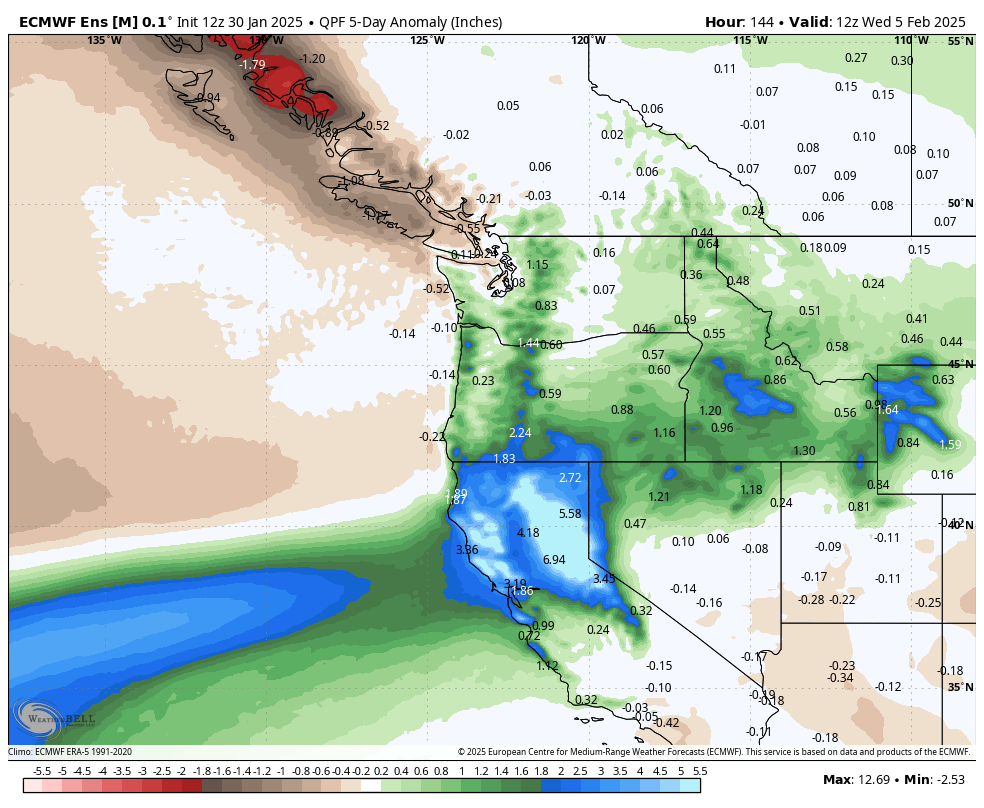
Portions of California are expected to really cash in, though unfortunately it will be mainly just the north, not Southern California. And places in the Northwest will be allowed to catch up over the next 5 days.
An atmospheric river will slam northern California with heavy rain and mountain snow, while the interior Northwest and portions of the Cascades play a bit of catch up in the precip department.
So, warmer nationally but a bit cooler and much wetter in the Northwest over the next 5 days. Then what?
Well, changes are afoot again. When we look for cold risks in the U.S., we often look to Alaska. Frequently, what happens in the Continental United States (CONUS) is that when a large ridge of high pressure pokes up over Alaska, it tends to dislodge the cold and send it south and east. Exactly where that ridge establishes, its strength, its duration, etc. can all yield differences in outcome. But in general, for meaningful cold in the CONUS, you need that to happen in Alaska.
A general correlation between Alaska ridging and US air temperatures over the last 15 winters shows that ridges over Alaska typically yield colder risks in the Eastern U.S. (NOAA PSL)
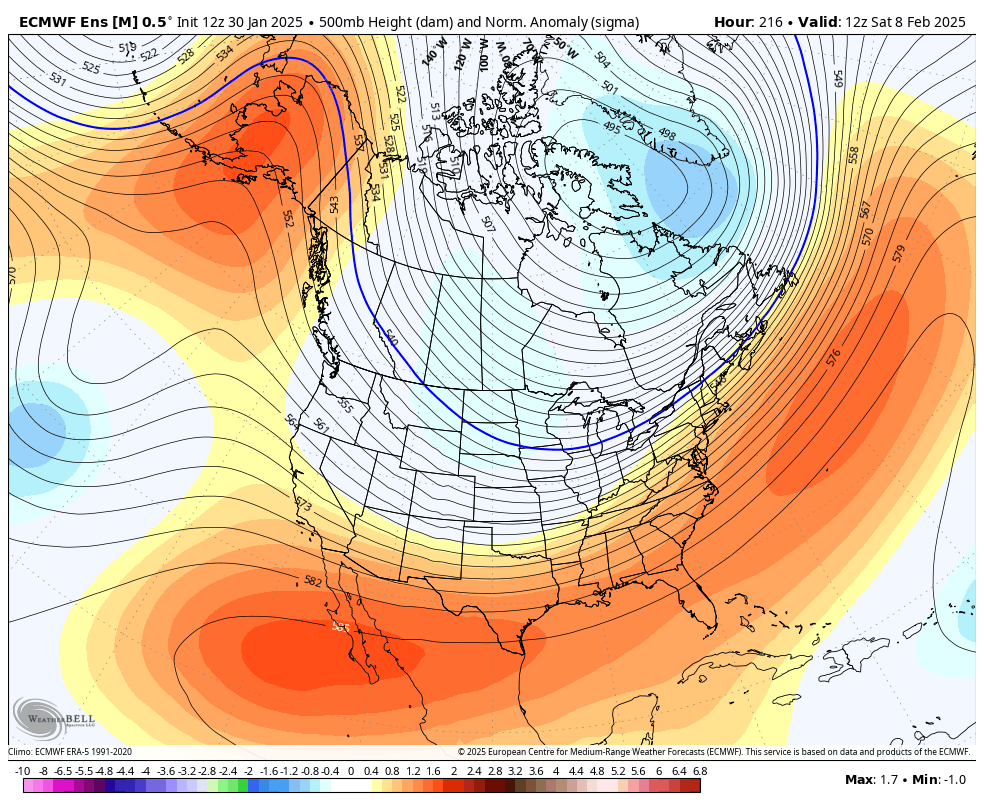
Well, the models are perking up a good bit about the potential for some meaningful ridging in the upper atmosphere over Alaska. In other words, they’re showing the pattern that would typically be favored to produce a colder Eastern U.S. In fact, today’s European ensemble model run shows basically a 2-sigma ridge over Alaska by next weekend. In plain language: That’s a potentially strong ridge.
A strong ridge may build up over Alaska next weekend, allowing for cold air to try and migrate eastward into the Midwest or Great Lakes. (Weather Bell)
Impressively, this shows up in the ensemble mean, which is an average of 51 different ensemble members. The signal is a bit weaker on the GFS model and in the AI modeling we look at, so nothing is guaranteed at this point. But with that said, there’s a signal here, and it’s one that says cold may reload for portions of the country where it’s currently absent. Something to watch in the days ahead.
Beryl was confirmed as the earliest category 5 storm on record in the Atlantic Basin. In the report, the NHC explains that while Beryl will officially go in the books as a 165 mph category 5 hurricane, there is a bit of ambiguity in that the peak intensity may have been slightly overestimated by the various methods utilized to estimate the intensity. It’s likely that if that peak intensity is incorrect, it is not off by much. Beryl made landfall with roughly 135 to 140 mph sustained winds on Carriacou Island in Grenada. No reliable observations of wind speed exist in that area.
Notably, Beryl’s landfall intensity was reduced significantly on the Yucatan. In real-time, it was assumed to have 110 mph winds. In the reanalysis, it is estimated to have maximum sustained winds of 90 to 95 mph. And then as we note in our Space City Weather post linked above, the landfall intensity was increased to 90 to 95 mph in Texas, up from 80 mph estimated in real-time.
A number of milestones prior to August were achieved due to Beryl including strongest storm (165 mph) so early in the season on record in the Atlantic, besting 2005’s Hurricane Emily in July (160 mph). I think one of the most impressive records Beryl matched though was the fastest rate of intensification (65 mph in 24 hours) so early in the season on June 29-30, matching July 2008’s Hurricane Bertha. Additionally, Beryl is now the storm of record for Grenada.
Beryl was a challenging storm in many respects, between impacts and forecasts. We learned a lot that helped us a lot through the balance of hurricane season, but you can be sure that Beryl will be on the list of names to be retired this year, likely including Helene and Milton.
La Niña checkup: It’s here, but will it stay?
Last we discussed La Niña, it was likely in the context of how the rest of hurricane season would behave or why the season did not quite go as planned.
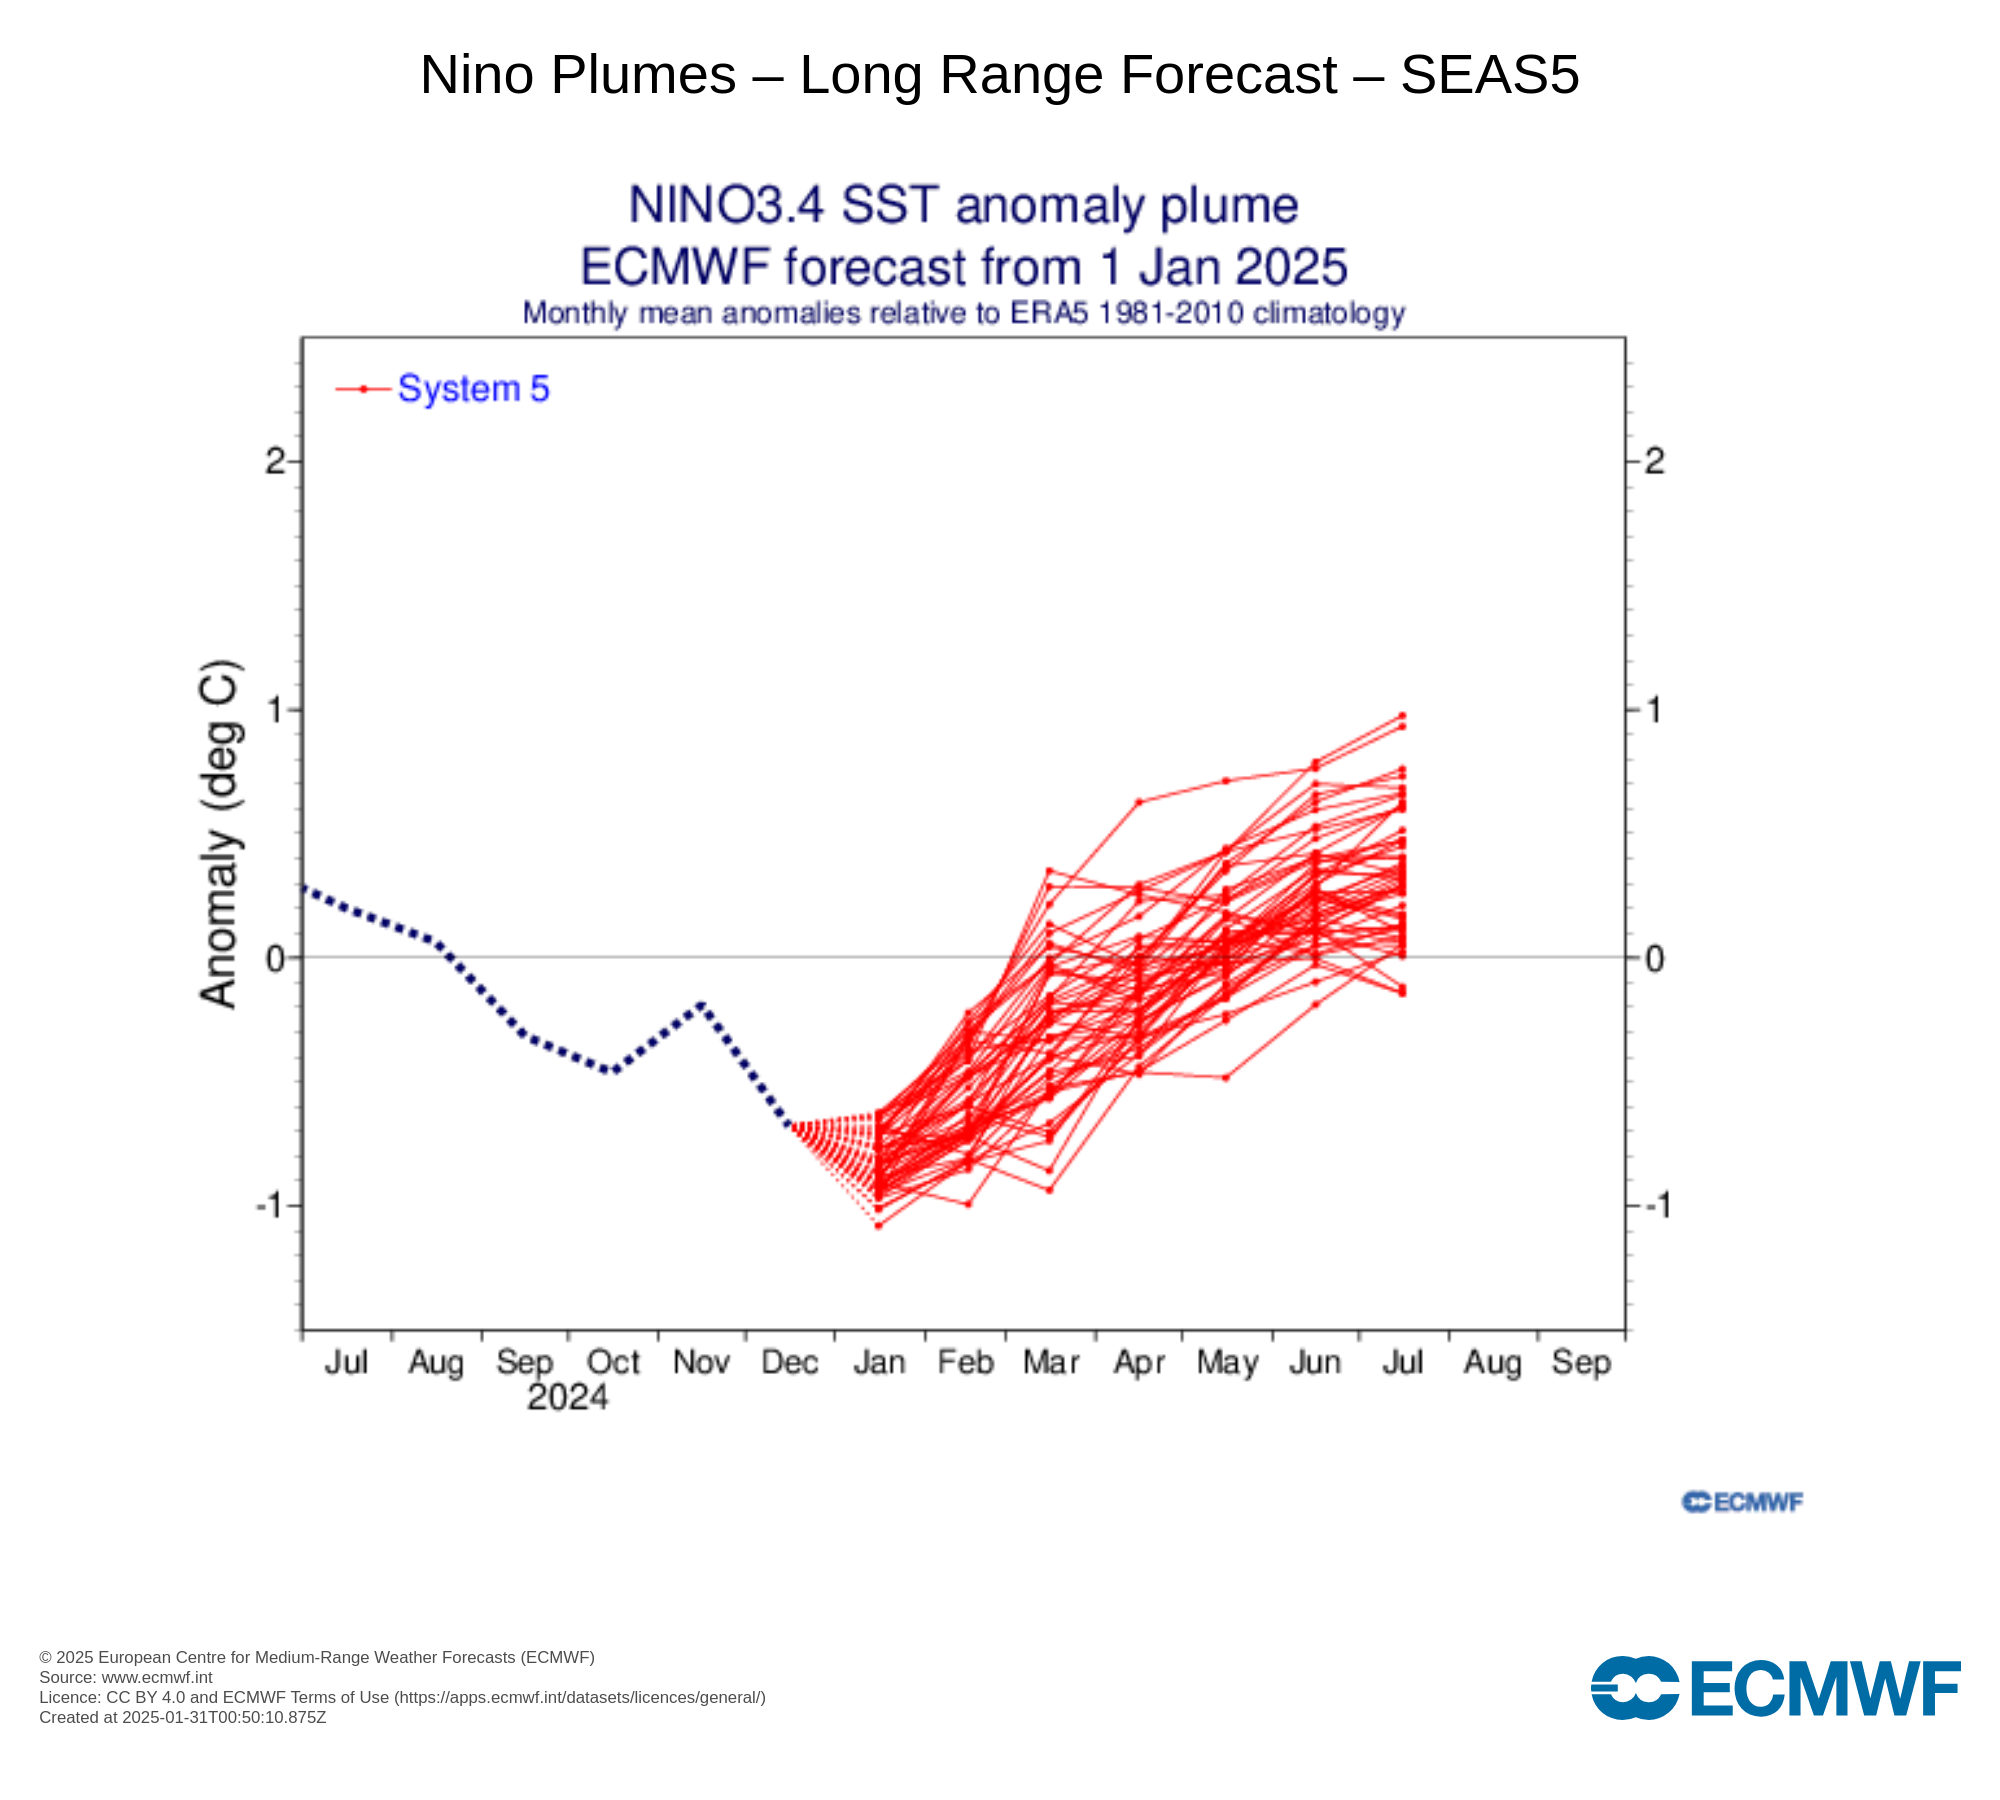
La Niña is here, and it’s likely to stick around a little longer. The summer forecast is much more uncertain, however. (ECMWF)
It took some time, but we officially had La Niña designated in December. So it’s here. That said, it’s not an especially strong one. This is one of the weaker first year La Niñas in recent years, I am guessing since at least 2016-17 or 2013-14. That’s not to say it won’t have impact. The dryness in SoCal and wetter conditions to the north are usual hallmarks of a La Niña, though it has been magnified to an extreme this year. Even weak La Niñas can aggravate other factors and cause major problems.
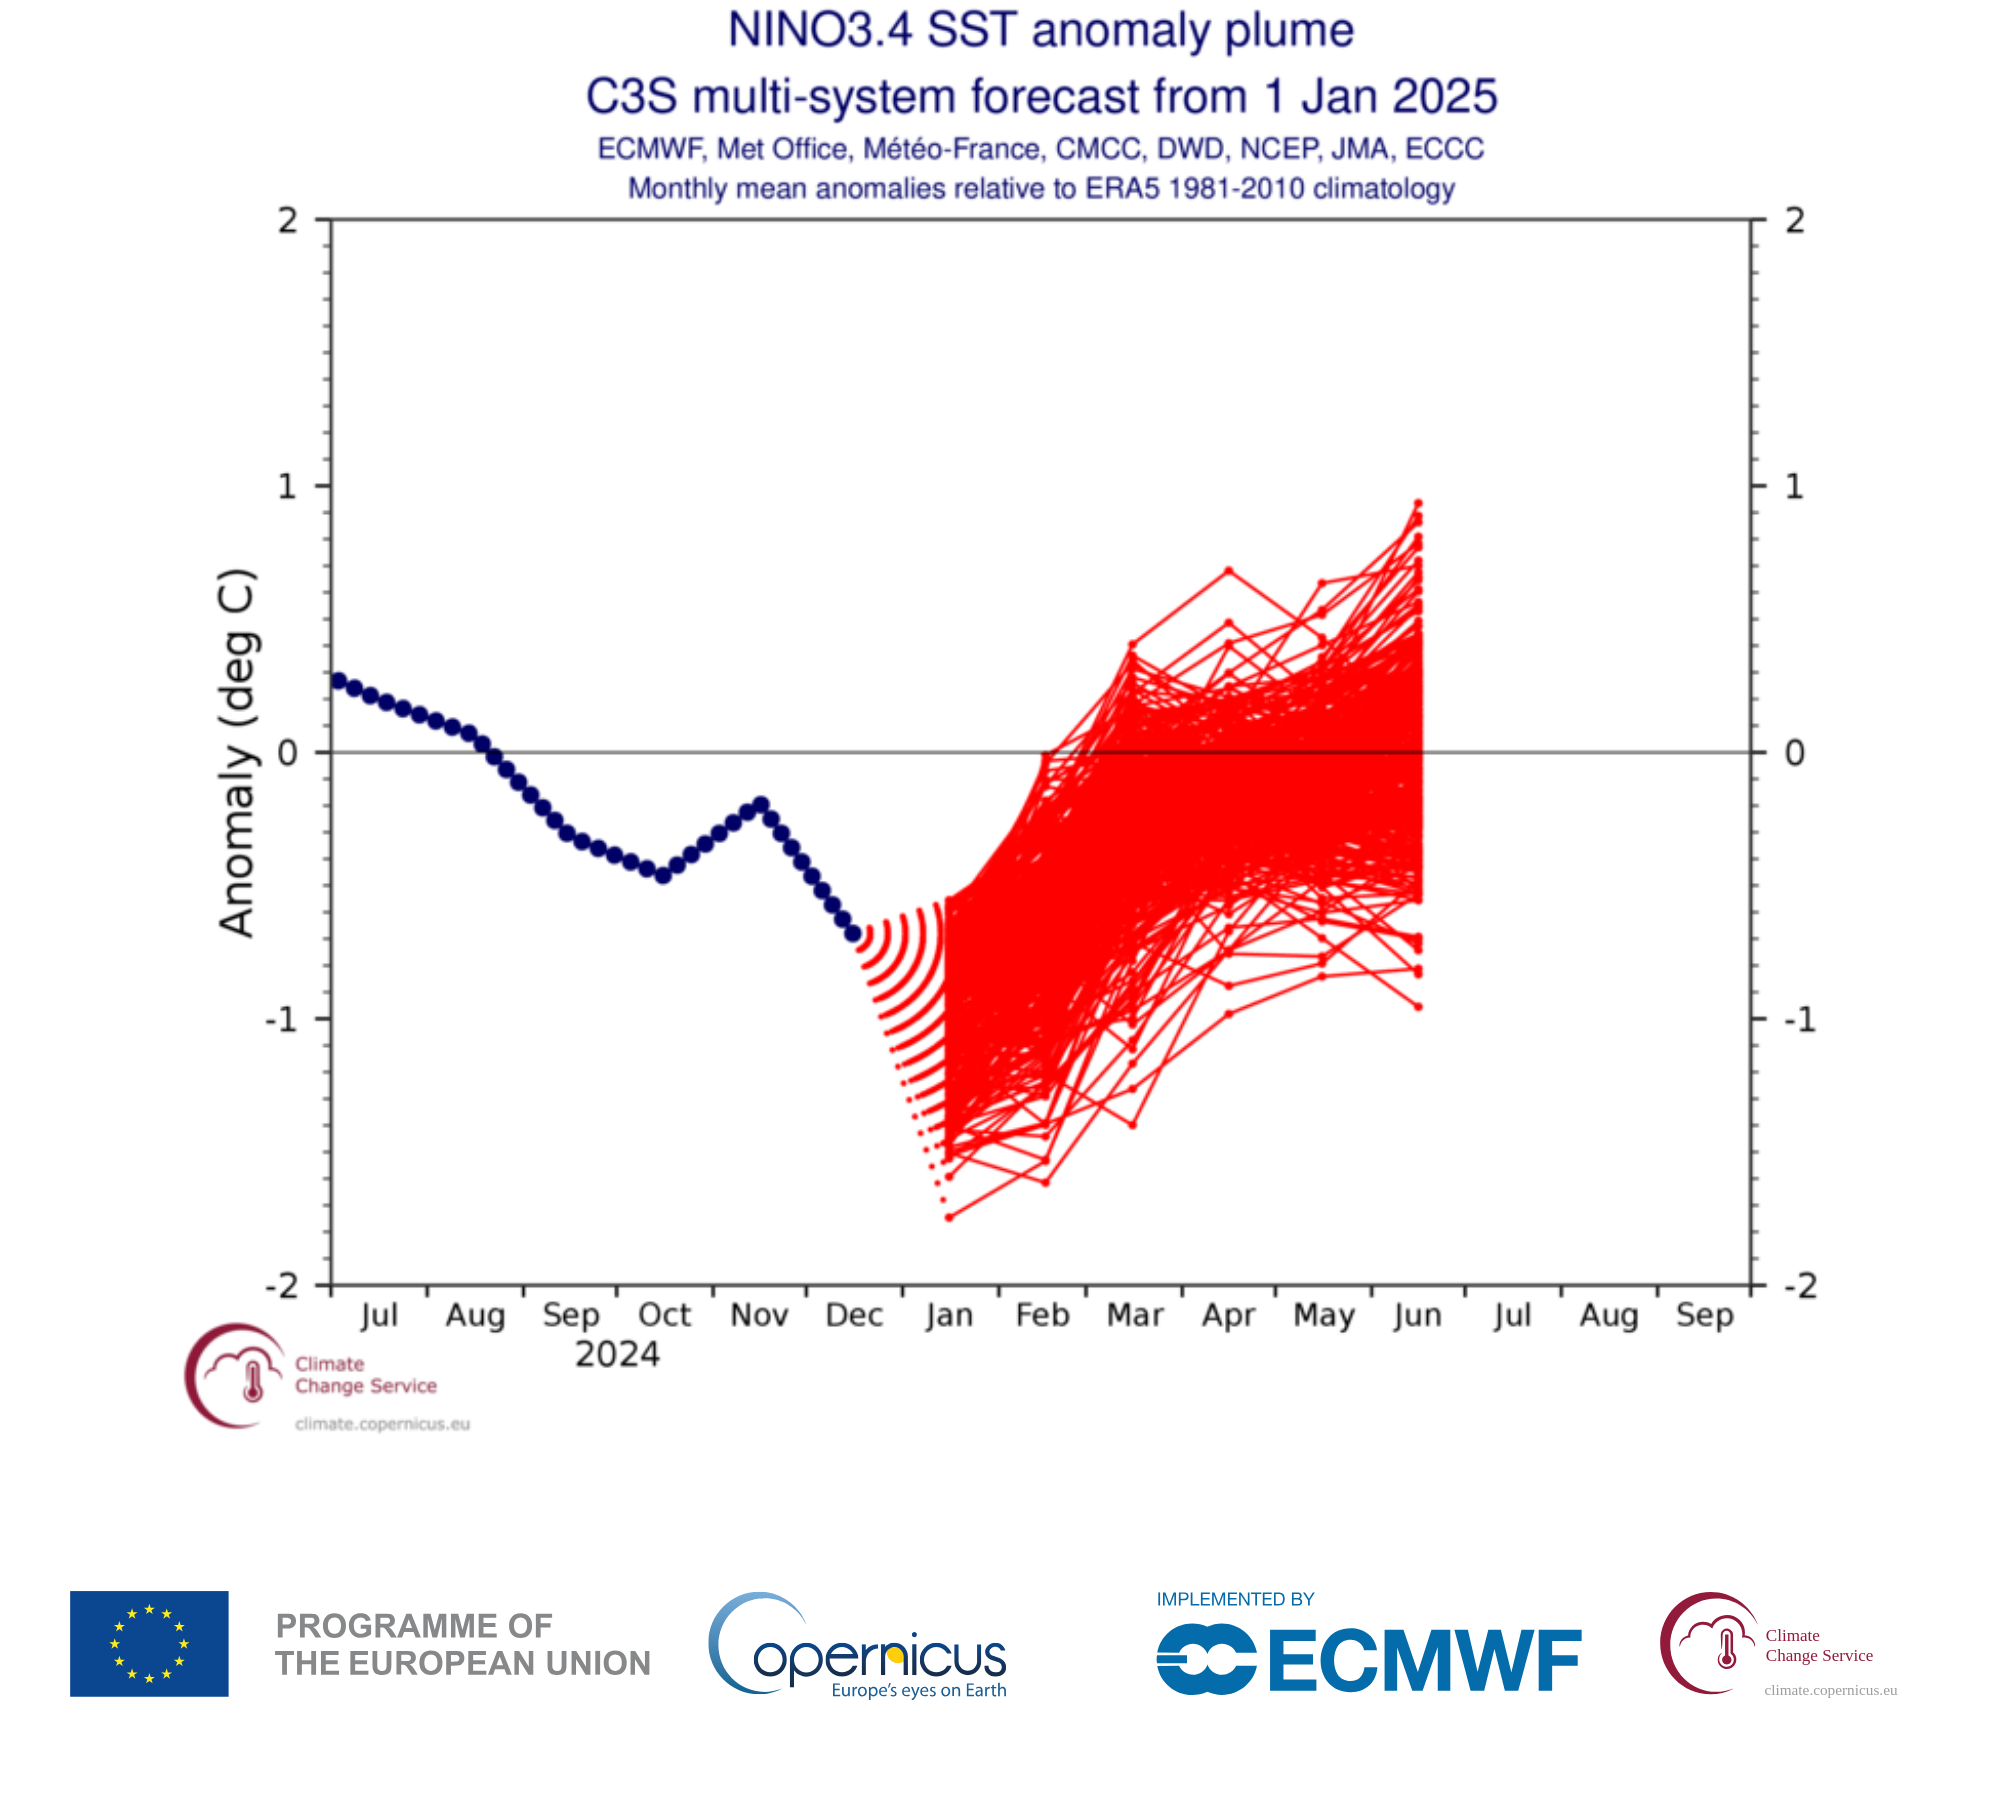
Per the ECMWF forecast above, we may shift into El Niño conditions in summertime. However, a look at the broader group of seasonal forecast models from eight different government agencies paints a much murkier picture.
A broader ensemble sampling says ¯\_(ツ)_/¯ (shrug) for summer. (Copernicus Climate Change Service)
We are entering what is known as the spring predictability barrier, where for some reasons that aren’t entirely clear, seasonal forecasting of El Niño or La Niña struggle. So, it’s wise to take everything with a grain of salt right now. We’ll continue tracking this as we head toward hurricane season, as it can have significant impacts on the season’s projected trajectory. Stay tuned.
Back in 2016 and 2017, I began researching Houston’s greatest snowstorm, which occurred on Valentine’s Day in 1895. The city received 20 inches. I was confounded by this because there is no other storm on record that comes even remotely close to this for Houston, and so I decided to dig in to learn more.
After reading a bunch of newspaper descriptions of the event, finding a few accounts in archives, and getting some incredible pictures from archives in Houston and Galveston, it became my absolute favorite weather anomaly of all-time. I mean, think about 20 inches of snow in Houston and what that would do today. Now, with all that said, I figured that was a one and done type of event; something we truly would never see again. And here in Houston, that still holds very true. But elsewhere?
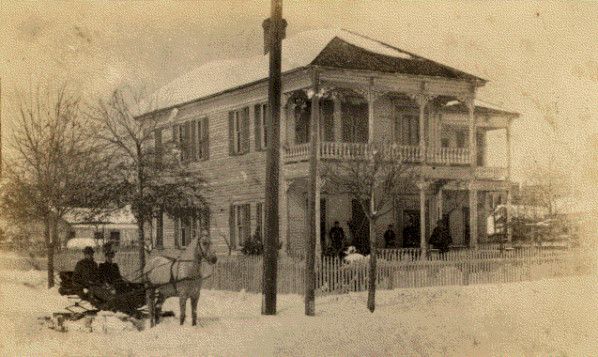
Lake Charles
The Miguel Rosteet home, corner of Pujo and Bilbo Streets, Lake Charles, Louisiana. Lake Charles received 22 inches of snow in 1895. (From the Maude Reid Scrapbooks, under indefinite loan from the Calcasieu Parish Public Library to the McNeese State University Department of Archives & Special Collections, Frazar Memorial Library)
Let it SNEAUX!❄️☃️ Check out these gorgeous photos from local photographer Darion Noble!📸
Lake Charles, LA received anywhere from 4 to 8 inches of snow in the area on Tuesday, falling well short of the 22 inches received in 1895, but still coming in as the third snowiest storm on record there (behind February 12-13, 1960 as well).
The Southwest Star (Sulphur, LA) from February 16, 1960 after the Lake Charles area’s second largest snowstorm on record. (LSU Library via newspapers.com)
Lake Charles also had their coldest two-day period since 1962. These types of storms seem to occur every couple generations on the Gulf Coast. While Houston did not set any major records and the Beaumont and Lake Charles areas saw one of their biggest storms on record, where things got wild was to the east.
Acadiana/Lafayette
Central Louisiana, or Acadiana (or the Atchafalaya) saw a truly historic storm. Having also had their coldest pair of days since 1962, they received anywhere from 6 to 13 inches of snow. The coldest recorded temperature was 2 degrees at Cade southeast of Lafayette on Wednesday morning the 22nd. Grand Coteau, just north of Lafayette measured 13.4 inches of snow. Lafayette itself managed 9 inches, a bit shy of 1895’s record of 14 inches.
“Sleds of every description were improvised for the occasion. Some of these were extremely ludicrous, as for instance, the case of Dr. G. A. Marin in a big rocking chair ploughing through the snow in happiest style.” –Lafayette Advertiser, February 16, 1895
“Everything took on a peaceful vibe as the snow transformed even mundane mail boxes into picturesque works of art.” – The Acadiana Advocate, January 21, 2025
Baton Rouge
Down I-10 in Baton Rouge, the capital saw 7.6 inches of snow, also a bit shy of 1895’s record of 12.5 inches.
The coldest back to back mornings in Baton Rouge since 1989 occurred on Tuesday and Wednesday thanks to the snow cover.
New Orleans
Some of the most enjoyable and spectacular social media posts I believe came out of New Orleans last week. The city recorded 8 inches of snow, just shy of the 10 inches the Big Easy saw in 1895. They also experienced their coldest two mornings since 1996.
Into Mississippi, Gulfport received 7 inches of snow. This tied with the New Year’s storm of 1963-64, which dropped similar amounts of snow east of New Orleans into Alabama but hit hardest north, away from the Gulf of Mexico.
The Daily (Sun) Herald (Biloxi/Gulfport, MS) from December 31, 1963 after a similar snowstorm. (via newspapers.com)
Thanks to the snowpack, Gulfport also had their coldest morning since 1985 (and third coldest on record back to the late 1800s) on Wednesday.
Mobile
Crossing into Alabama, Mobile had a truly historic event, logging their largest snowstorm on record. The 1895 storm dropped a half-foot in Mobile, while the 2025 storm produced 7.5 inches. Like the Mississippi coast, Mobile had their third coldest morning on record and coldest since 1985 on Wednesday. Even Gulf Shores and Orange Beach saw 7 to 9 inches of snow.
Pics of my parents home and the beach in Gulf Shores, AL . Wild times with that much snow! The one time I’d like to have gone back for a visit in winter! ❄️
For Florida, the storm will now be the benchmark on which future storms are measured. Prior to last week, Florida’s state record for snowfall had been 4 inches recorded in Milton, FL back in 1954. Officially, Pensacola managed 8.9 inches in this storm, with a few locations, such as Milton and Ferry Pass, just north of Pensacola achieving 10 inches.
Frosty and his son taking some vacation time down in Florida after all the snow #photography #nikon #snowman #frosty #beach #snow #florida #pensacola #floridasnow #travel #sunset #winter #snowstorm
To the east, Panama City saw 3 to 4 inches of snow, while Tallahassee saw just shy of 2 inches, their largest storm since February 1958’s nearly 3 inches of snow. Even Jacksonville got on the board with a tenth of an inch of snow, only the fifth time they have recorded measurable snow.
The meteorology and differences from 1895
So what happened here, and how did this storm differ from the great 1895 storm? The meteorology had some strong similarities but also key differences in both storms. In 1895, low pressure formed in the southwest Gulf of Mexico and tracked eastward across South Florida and off the East Coast.
Animation of sea level pressure anomalies from the 1895 storm showing low pressure forming in the southwest Gulf and tracking east and northeast. (NOAA PSL)
The combination of strong high pressure (indicated by the deep red colors over Texas) and overrunning moisture from the Gulf likely led to a significant thump of snow before the storm consolidated well offshore, taking the heaviest snow with it into the Gulf and grazing the Gulf Coast.
The 2025 case was much different, even if it was somewhat similar. In this year’s case, you barely had a formal low-pressure system over the Gulf. So my hunch is that in the 2025 case, you had less consolidation of the storm offshore, meaning more moisture was available to plow into areas like Louisiana, Mississippi, Alabama, and Florida. Texas had more time with things in 1895 so was able to cash in more then than now.
High pressure dove into Texas (indicated by the red and orange colors) to supply cold air for moisture to feed in off the Gulf and fall as snow. No formal low pressure really got going until it was well offshore of the Carolinas. (NOAA PSL)
There are some other factors at play in 2025 vs. 1895. For one, there was less snowpack on the Plains this time around, so Texas was a bit slower to turn colder. The trajectory of the cold was very similar in 2025 versus 1895 but less snow meant more modification of the air mass this time. That probably also played a role.
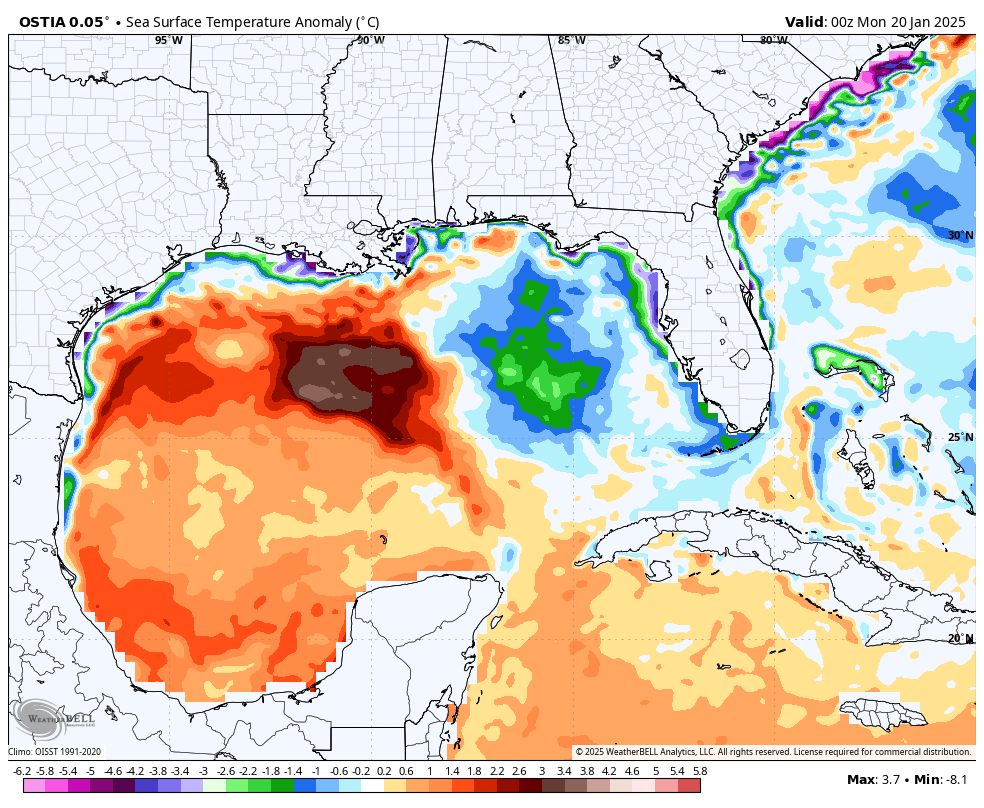
Another reason this storm did what it did farther east? The warm Gulf of Mexico. Monday’s sea-surface temperature anomaly in the Gulf showed widespread warmer than normal temperatures over a broad portion of the western Gulf.
Sea-surface temperatures were running as much as almost 4°C above normal in the middle of the Gulf of Mexico last week. (Weather Bell)
In fact, some of those SSTs were almost 4°C warmer than normal, which is ballistically warm. There’s a case to be argued that the warmer Gulf, which is due to a combination of factors, including climate change played a role in “juicing” this storm a bit more, especially as it moved east. In fact, I might be willing to argue that an identical storm occurring in 1895 (not the 1895 storm, but rather this exact storm unfolding exactly as it did, except 130 years earlier) may have actually produced less snow in Louisiana through Florida due to what was likely a much colder Gulf of Mexico in 1895. The caveat to that is that a colder air mass as would be likely in 1895 could have boosted snow to liquid rations even more and produced a similar snowfall with less available moisture. It’s a fascinating possibility to consider, but unfortunately there’s no real way to know for sure.
But what we do know is that storms like this are truly rare on the Gulf Coast, and many core memories were made for many kids (and even some adults) last week between Houston and Florida.
I wasn’t quite sure where to go with this post, but we’re a weather blog, entrusted by a lot of people to give “to the point,” hype-free information. And we’d be remiss if we didn’t at least chime in on what’s happening out West. It’s tough to watch what has been happening in California without some sort of visceral reaction. This doesn’t feel right. It isn’t normal. This is our new reality.
What is “normal,” anyway?
But it’s important to step back and look at what has happened in California and try to understand it and try to make sense of living with risk. California has a climatological normal, apparently. There is a “normal” value of rain or snow or temperature in California. But that normal is really just taking years of extremes and averaging them together. The normal in California is and has always been extreme. A former colleague of mine used to describe “average” by using the analogy of the river being 4 feet deep across “on average.” Which is to say, at some points, that river may be 20 feet deep. At others, barely six inches deep. In that sense, California has average or normal weather.
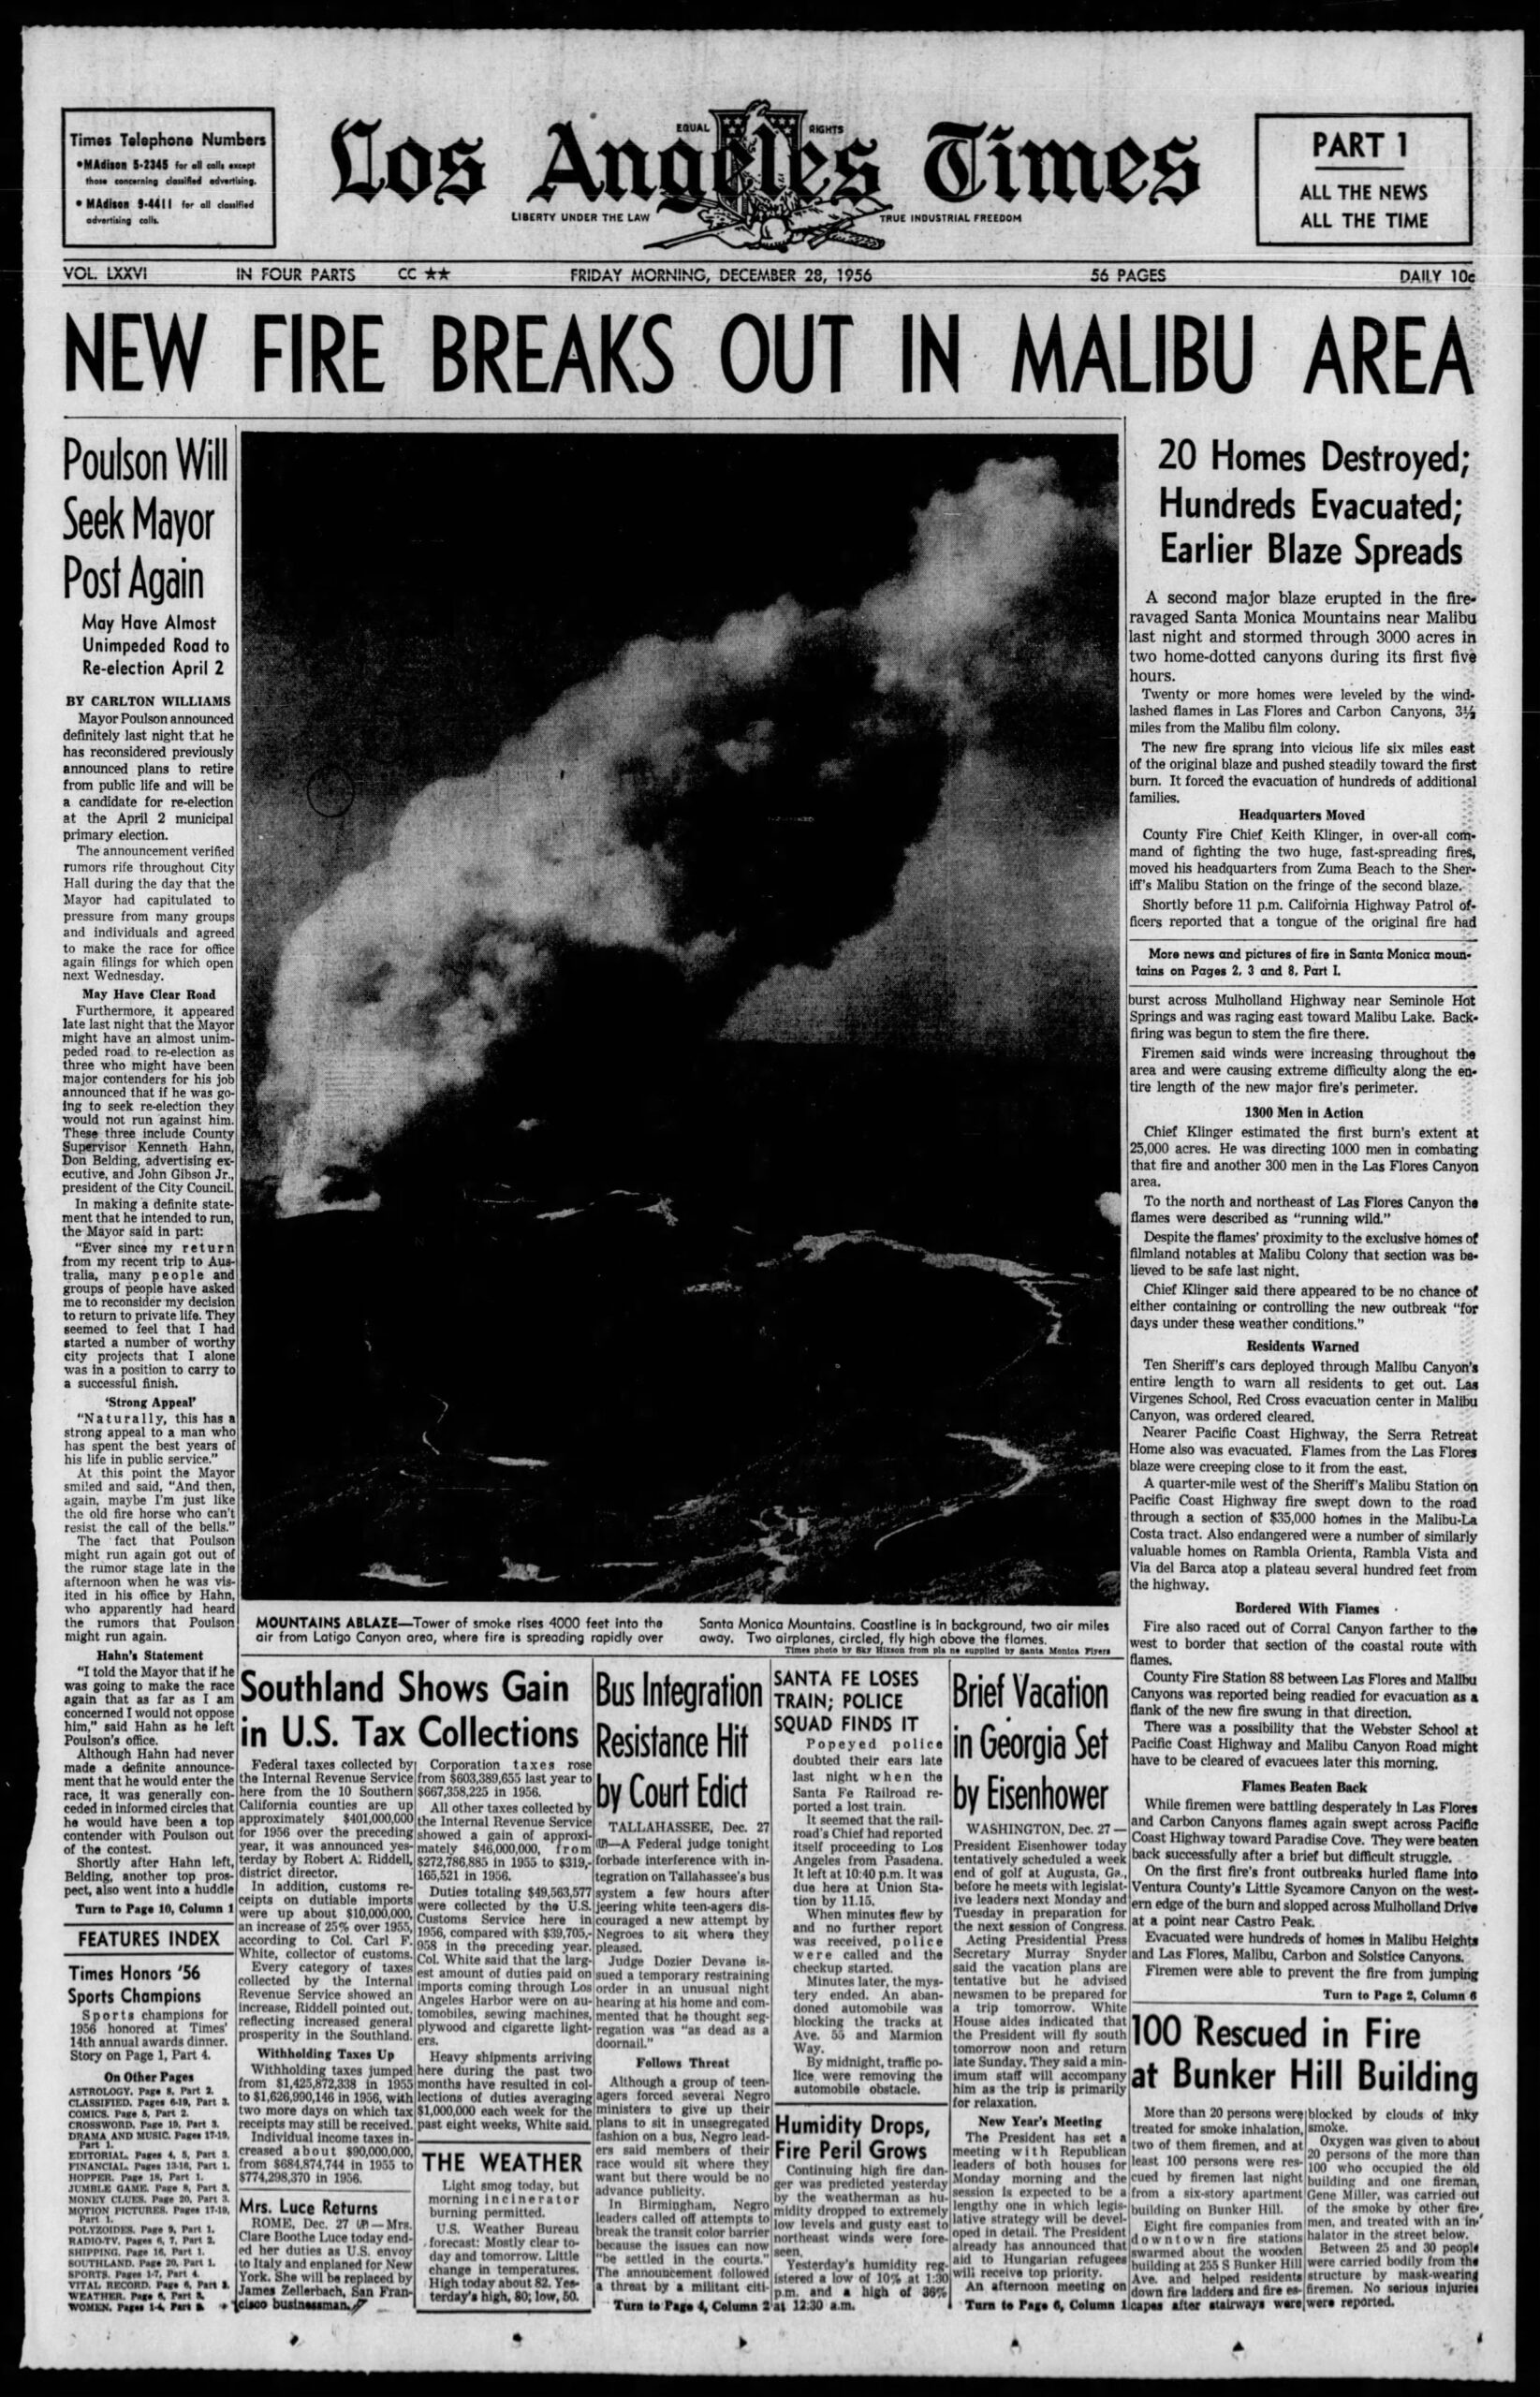
Is a winter fire season “normal” in California? Not really. But it’s not unheard of either. The front page of the L.A. Times is below from December 28, 1956. This was a rough wildfire episode in the Santa Monica Mountains.
Front page of the Los Angeles Times, December 28, 1956. (LA Times via newspapers.com)
From that December 28th, 1956 edition, “Wind, humidity, drought, and other factors have combined to make the Santa Monica Mountains fire almost impossible to combat with usual methods, firemen reported yesterday.” Further, “existing firebreaks are simply jumped by spot fires which pop up 100 feet and more from the main mass of flame.” Does this sound familiar? It’s important to understand these things so we don’t lose sight of the fact that just because perhaps there were a number of years where something didn’t happen, it probably wasn’t more than dumb luck. Fires in the dead of winter, while uncommon, can, do, and have historically happened.
It also brings me to a challenging, difficult point to make. Let’s be clear: Climate change is real, and it is making fires burn hotter, more intense, and more frequently in these traditionally more typical offseason periods. Would we have seen the type and intensity of fires we see today under the exact same weather conditions in 1956? Probably not. But climate change is not at all the sole “cause” of these fires being as bad as they are. The reality is always nuanced and difficult and messy. We’re not going to get into all the reasons here but vegetation management? Kind of important! Political decision-making? Important. Water supply constraints and infrastructure? Important. Population growth and sprawl? Important. Regulations and required environmental reviews? Important.
Yup. When the Forest Service identifies high-risk forests needing prescribed burns, it takes an average of 4.7 YEARS just to get through environmental reviews. For complex projects, it's 7.2 years – longer than many fire cycles. https://t.co/nITtIe9bDdpic.twitter.com/p9i1hmeQne
Climate change? Important. It’s all important, but to box it in as one issue, neat, tidy, and clean is a misnomer. And as disaster expert Samantha Montano put it “if you minimize the cause to just climate, you prevent us from being able to address the full spectrum of causes.” (emphasis mine)
I don’t ‘deny climate change is real’ but I do think people too often use it as a catch-all term that is quite empty and actionless and distracts from many other things going on that can actually be evaluated. It feels like everyone is just pointing at air in the sky and then…
All this to say that despite some of the obvious reasons like climate and population growth that have led to fires worsening in California, it remains an extremely complex issue with complex causes that are not singular or simple to solve.
What set this event apart?
So what made this specific event so bad? Let’s start with the fundamental problem: Drought.
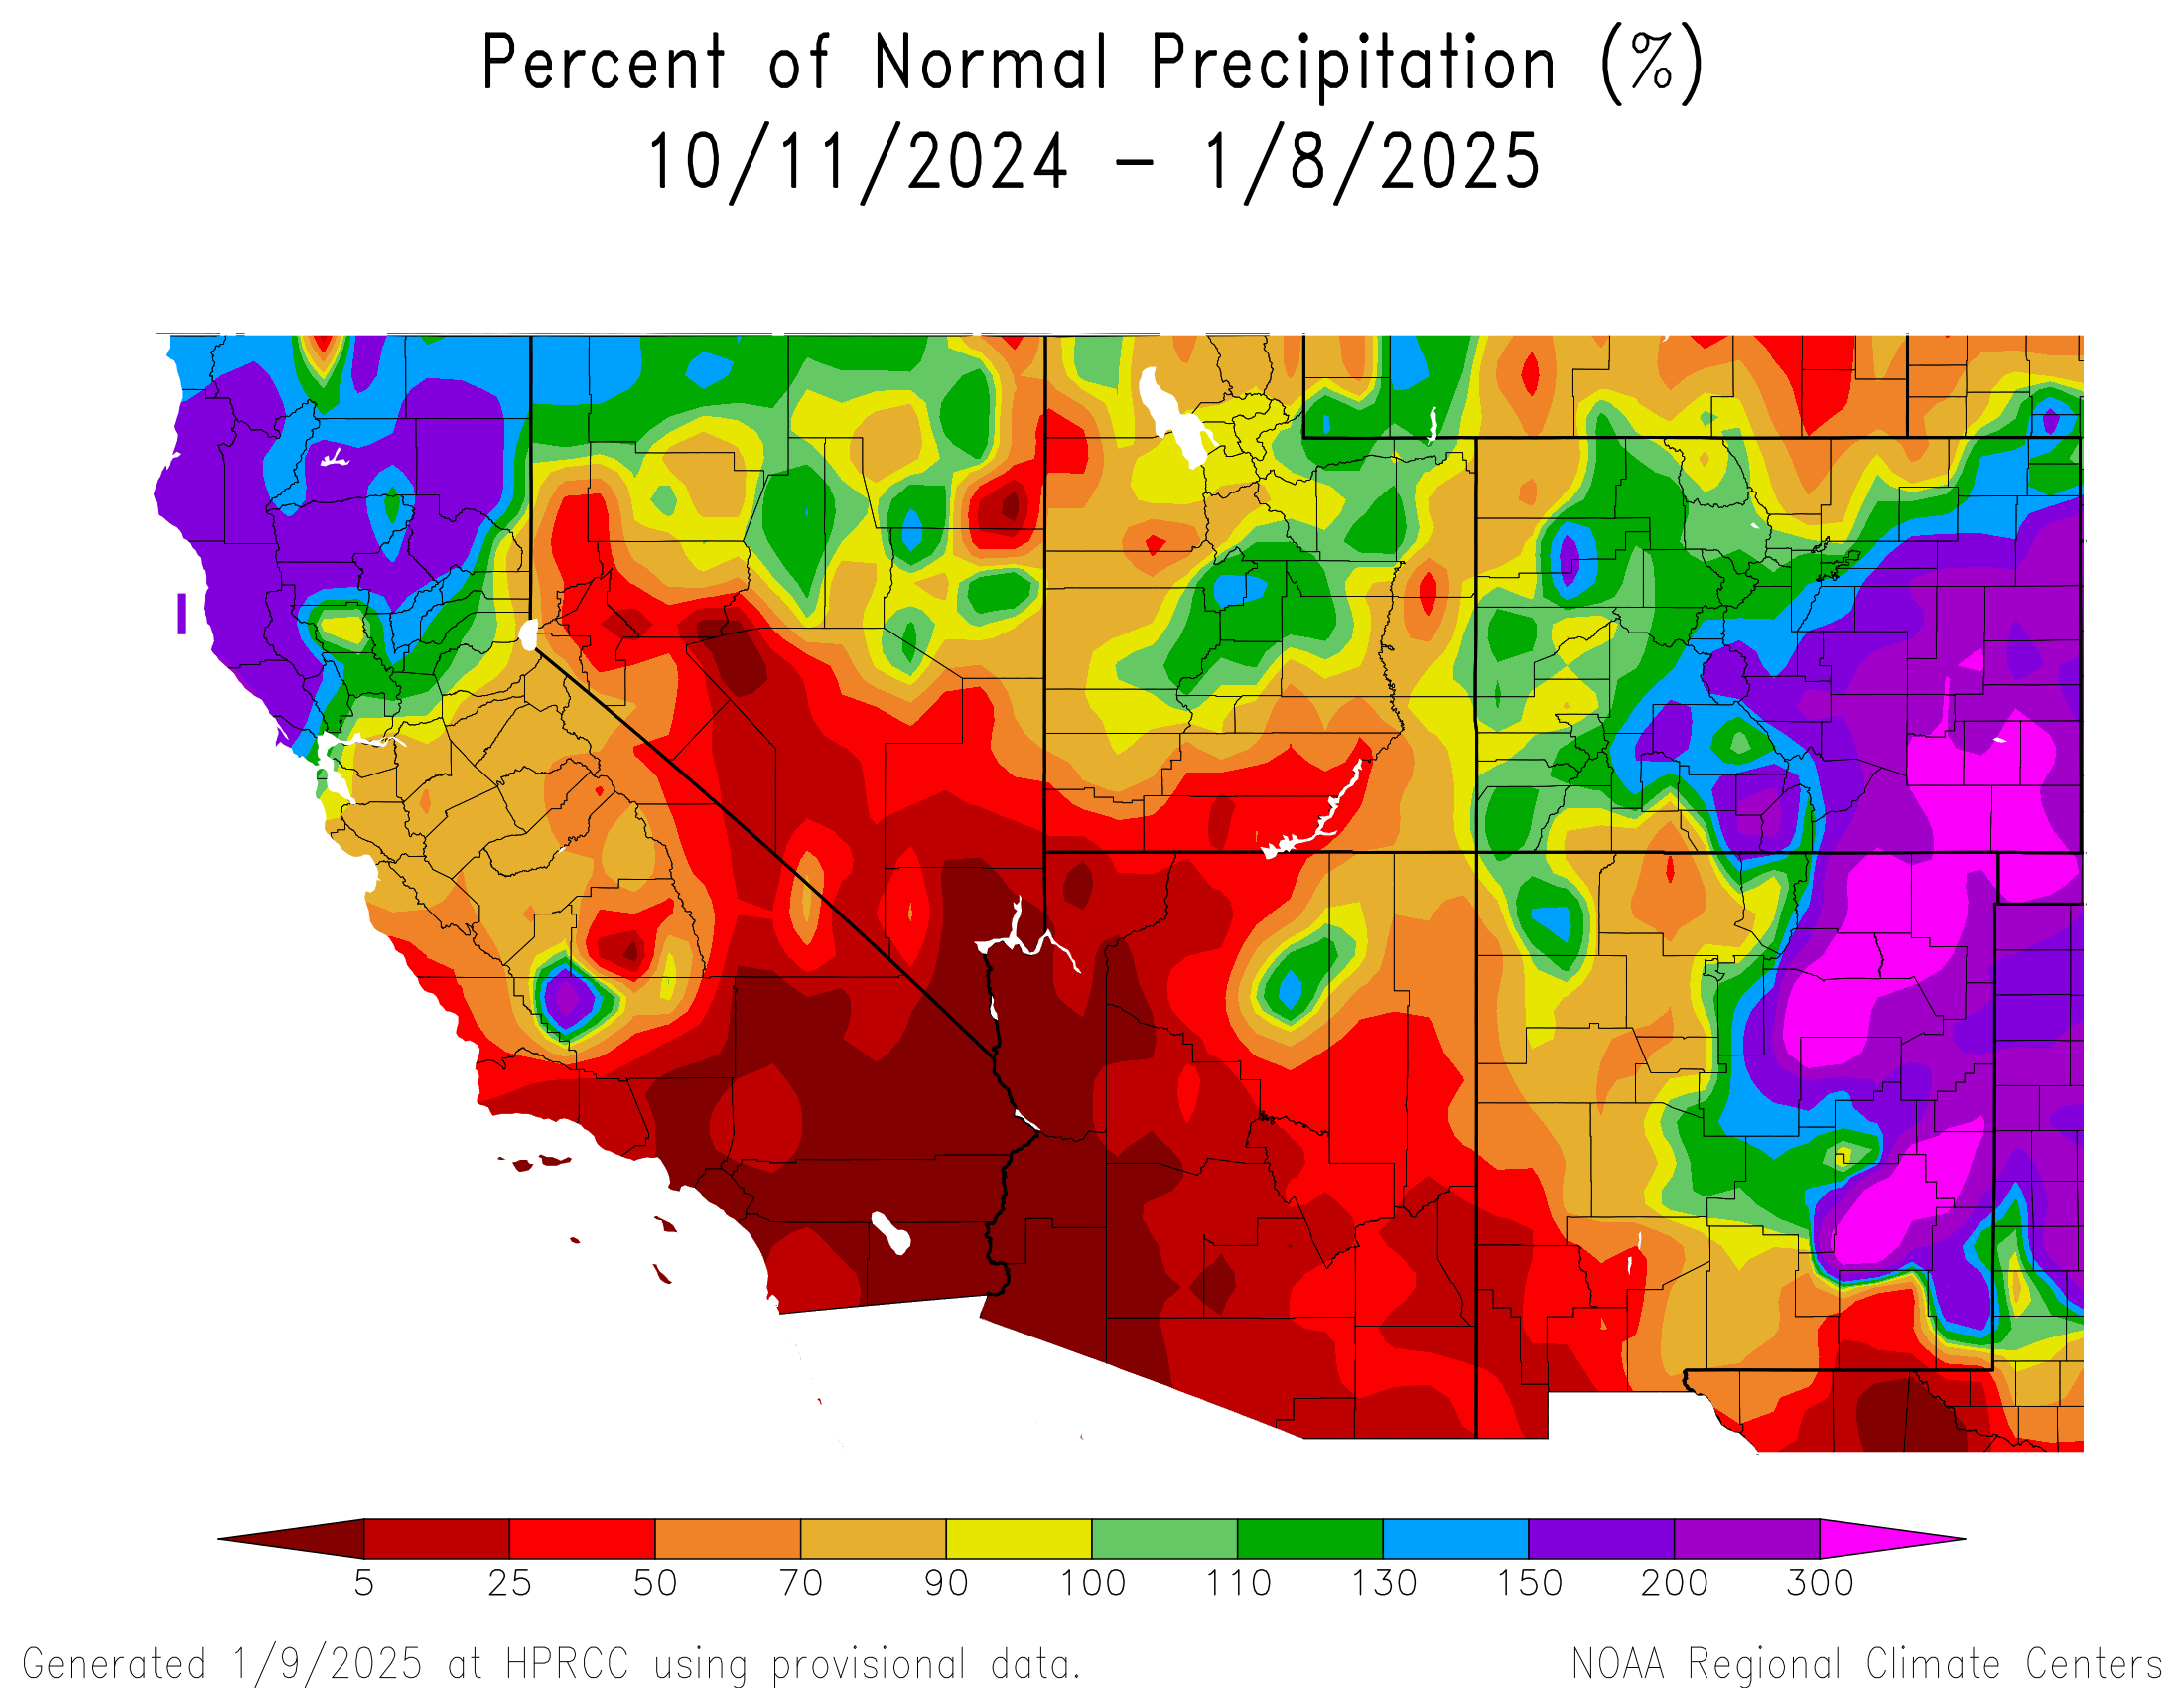
California has seen a totally split weather regime so far this wet season: Rainy north, bone dry south. (High Plains Regional Climate Center)
This winter has been borderline ridiculous in terms of how split the difference is in regime between northern California and southern California. San Francisco is sitting at 10.39″ of rain downtown for the season, compared to a normal of 9.44″ to this point. That’s about 110 percent of normal. Downtown Los Angeles? 0.16″ of rain so far this season, compared to an average of 4.76″ typically. That’s about 3.3 percent of normal. Southern California has had absolutely nothing this winter so far. Things have dried out, and there have already been two or three decent Santa Ana wind events to help exacerbate the drying out of fuels in this region. In other words, this is about as bad a scenario as you could ask for without any external triggers.
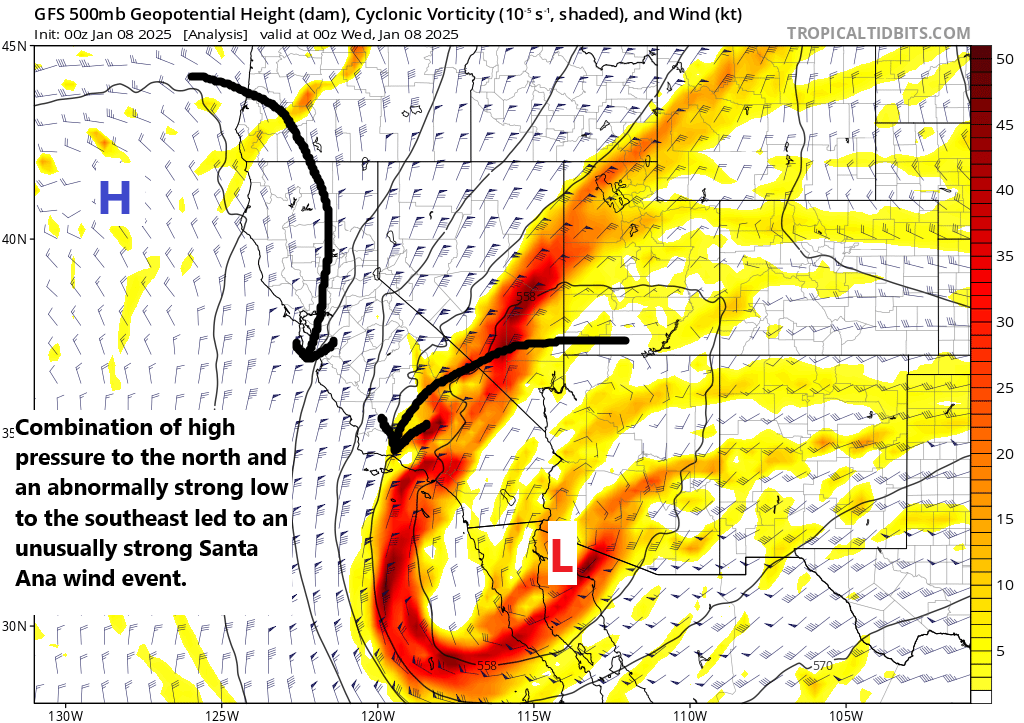
Unfortunately, the external trigger came on Monday and Tuesday in the form of strong Santa Ana winds.
A classic and unusually strong Santa Ana wind event setup across California early this week, peaking on Tuesday evening. (Tropical Tidbits)
Winds gusted as high as 100 mph in the mountains above Altadena (where the Eaton fire impacted), in the 80s above Malibu, and in the 60s in many other areas. These were unusually strong winds by Santa Ana standards, likely exacerbated by what we call mountain waves. As winds from the north hit the east-west oriented San Gabriel Mountains, the winds are forced up over the mountain and then thrust down into the populous valley below. A lot of times, you’ll see more of a northeast type wind usher in the Santa Anas, with typical isolated pockets of strong winds. But when you get this level of north push, you can basically create a standing wave over the mountain which just leads to constant wind being pushed down below. While the Santa Anas typically come with strong winds, events like this in these specific areas are somewhat rarer, particularly having such a strong storm as was setup over Baja. And it was exceptionally well forecast ahead of time, which is why dire warnings were issued days in advance of this happening.
As these winds get forced downward, through the high deserts, then down mountains to the coastal plain, the air dries out further as well, which is why you end up with such a perfect recipe for fire danger in these wind events.
Will it get any better?
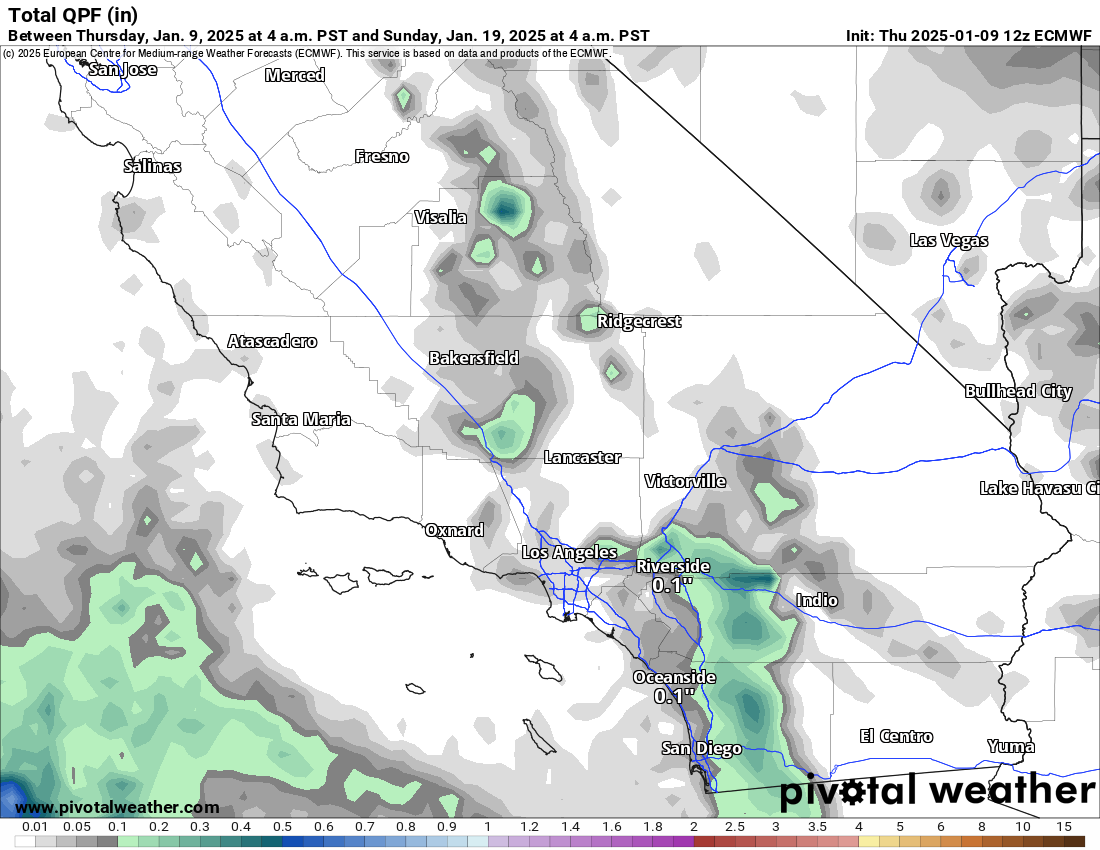
The short answer is not really. If anything, there will be continued offshore winds and fire risk as additional cold air gets pushed east of the Continental Divide next week. This likely means another period of borderline critical fire danger in SoCal next Monday and Tuesday. Rainfall over the next 10 days from the European operational model looks paltry at best.
Meager, minimal rainfall is expected in Southern California over the next 10 days. (Pivotal Weather)
Winter precipitation patterns can change in a hurry on the West Coast, and obviously the major scarring from these fires means that there will be a major sensitivity to heavy rainfall if and when it does occur again. Be it this year or next year. So, this area will not see dry conditions improve over the next week or two in all likelihood. Let’s just hope that forthcoming offshore wind events lack much bite.