In brief: Today we update on a disturbance east of Bermuda that is flailing a bit and has a low probability of development. We also take a deep dive into the flooding that hammered southwestern Connecticut on Sunday.
Tropical Atlantic
We begin today in the Atlantic, where the odds of open Atlantic tropical development have waxed and waned over the last few days, and in very 2025-26 fashion, they seem to be struggling mightily.
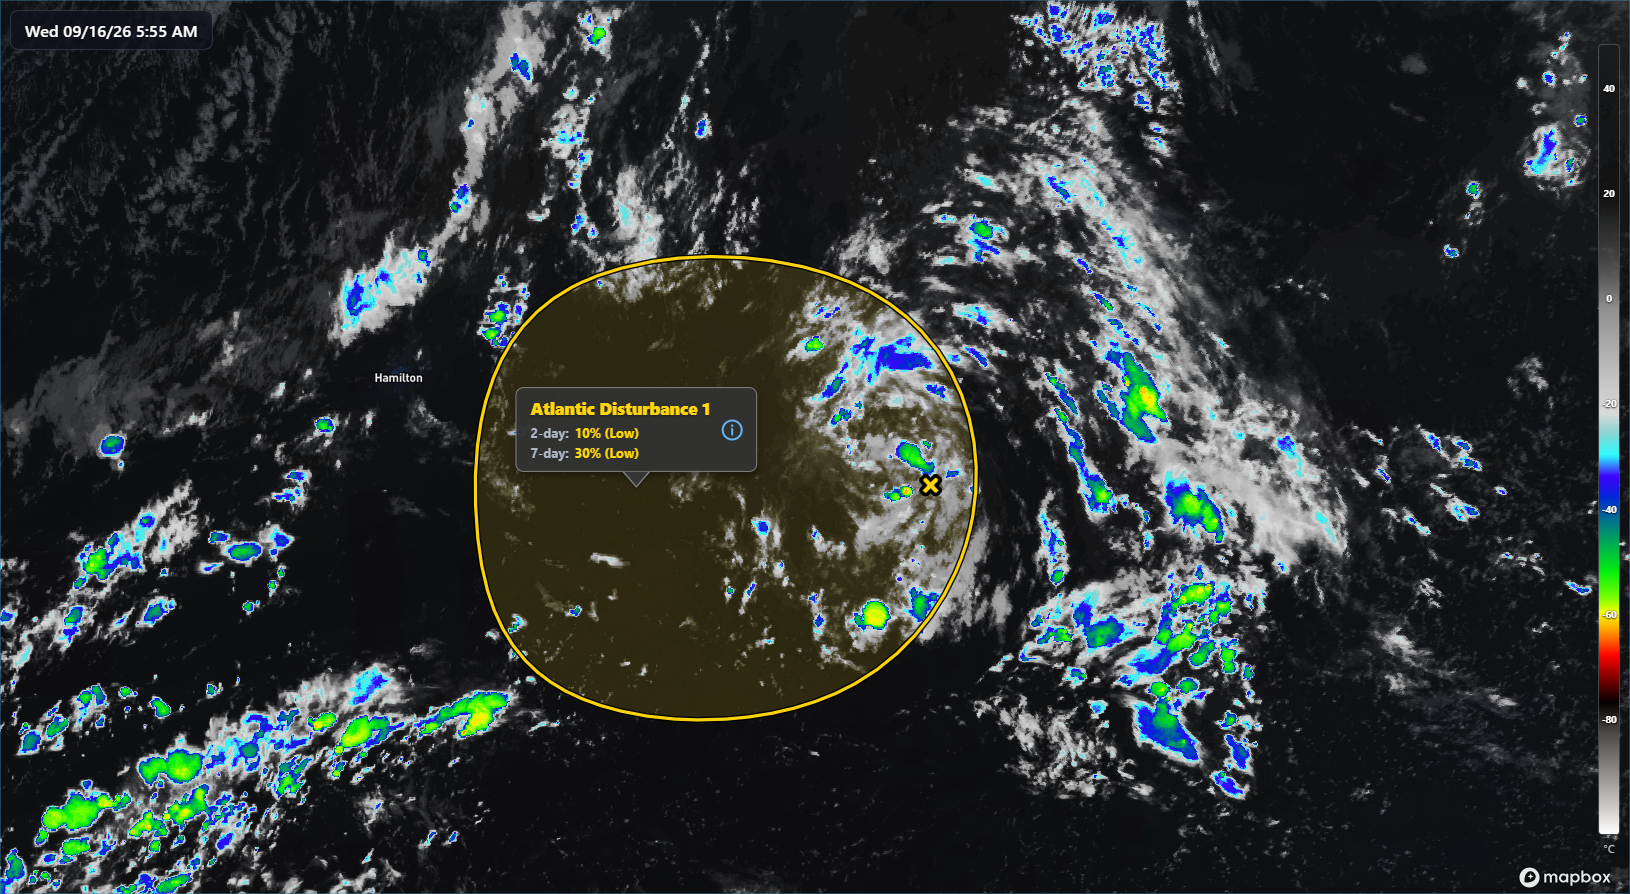
On satellite, you can see that this thing is not even challenging invest status right now, let alone heading for development. Over the next few days, the disturbance behind these clouds will drift west, inching toward Bermuda. Any development risk is very low and would almost certainly be very slow initially. Wind shear in the area is fairly low, but this disturbance is fairly broad in size and just does not seem really able to congeal around a tighter center in the modeling.
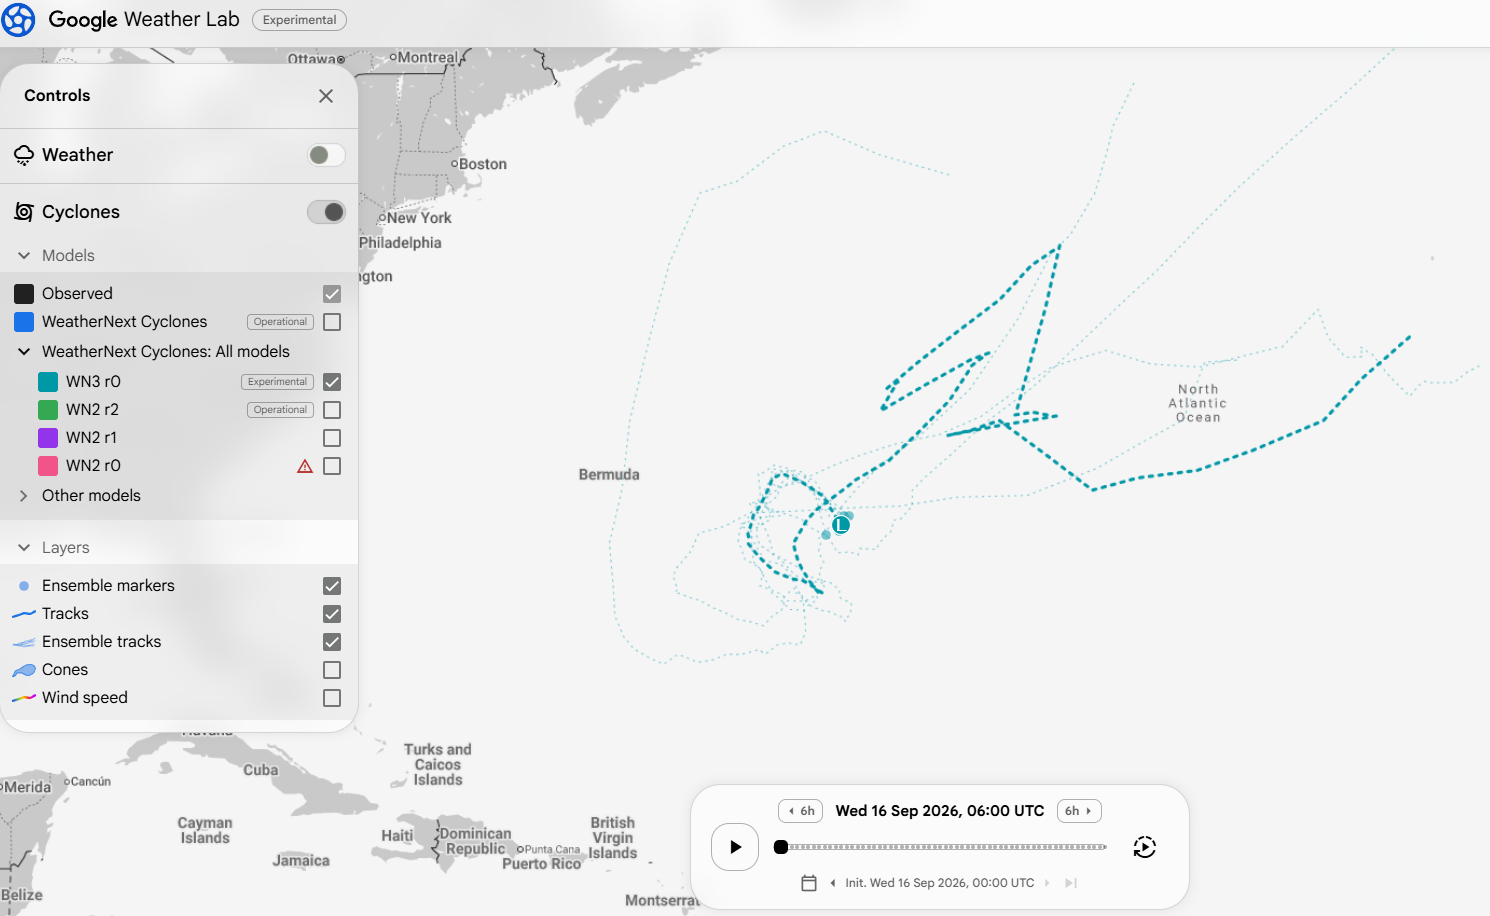
Google’s WeatherNext model still does hold out some chance it can do something, with about 20 percent or so of the members of WeatherNext 3 showing development. The larger 1,000 member ensemble shows about 40 percent odds of development. It’s somewhat notable that the ensemble members that do develop this system in many cases make it a stronger one. So, I think the points here are: This is unlikely to impact land, the chances of development remain in the 20 to 40 percent range, and if it can develop, it has potential to become a stronger storm. We’ll keep watching for educational purposes.
What else?
You had to ask? The answer is nothing. Right now. I will say we are beginning to see some “noise” in various ensemble members that suggest something could be afoot near the Gulf or in the deep Atlantic at some point over the next 10 to 14 days, but there is nothing specific we can zero in on right now. So at this point, it’s the meteorological equivalent of uncorroborated information. We will keep watching and get more specific if and when the need arises.
Anatomy of another Connecticut flooding event
This summer was the wettest on record at the primary observing site in southwest Connecticut, in Bridgeport. By about an inch, 2026’s 21.24″ in Bridgeport bested 1972’s 20.23″ for wettest summer since 1948. We just added the 13th wettest day on record this past weekend, when Bridgeport recorded 4.25 inches of rain over the course of about 3 to 4 hours. Some parts of Fairfield County and east of New Haven were hit even harder.
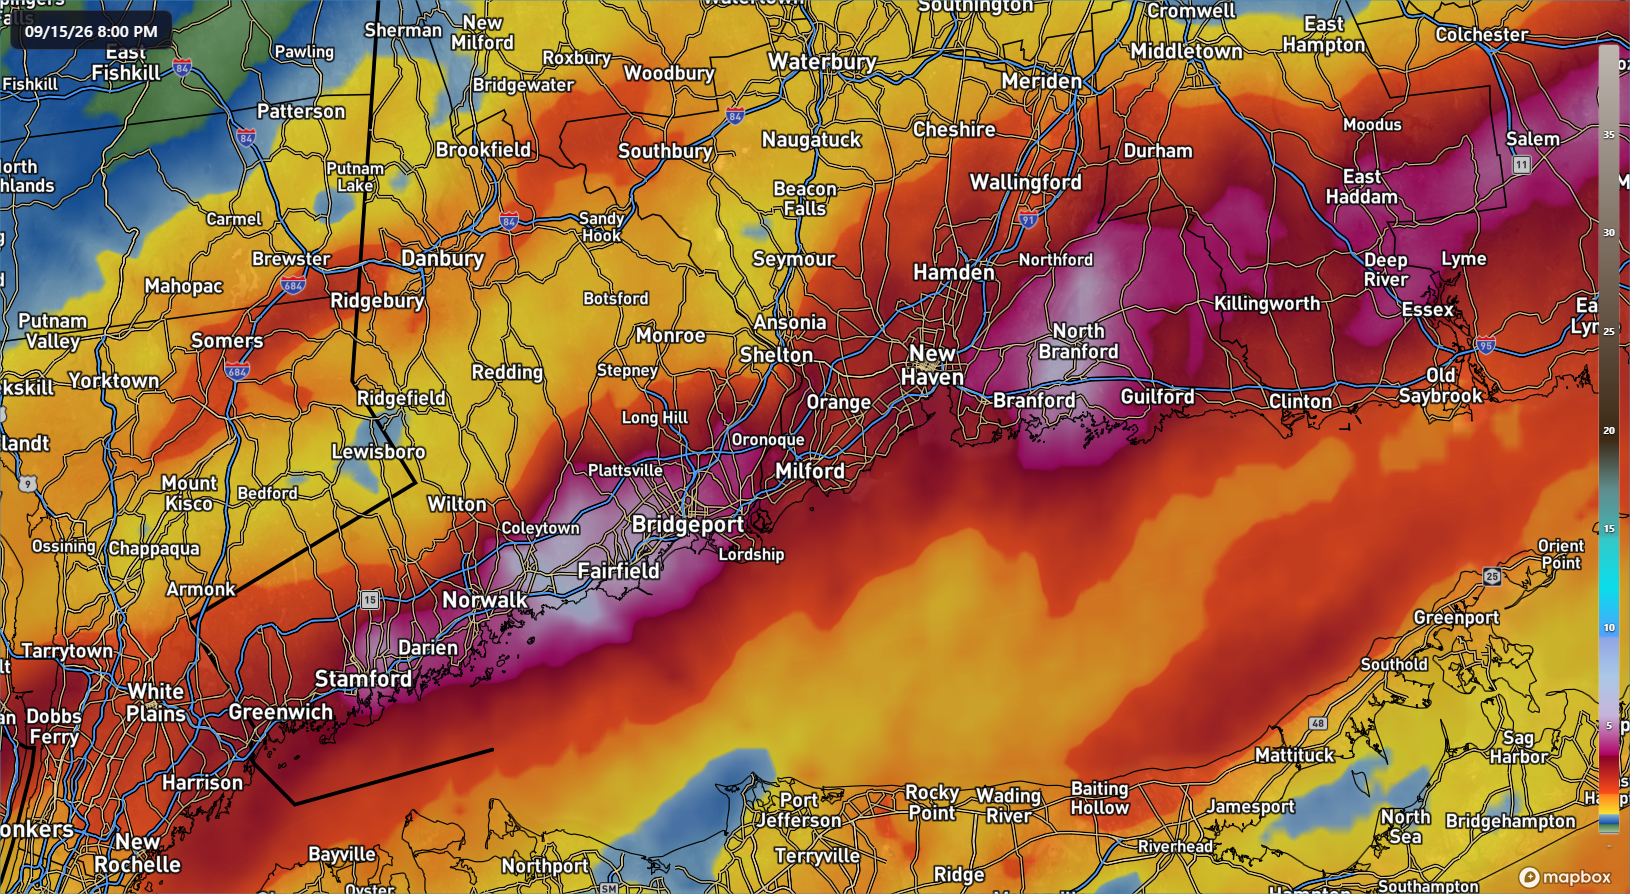
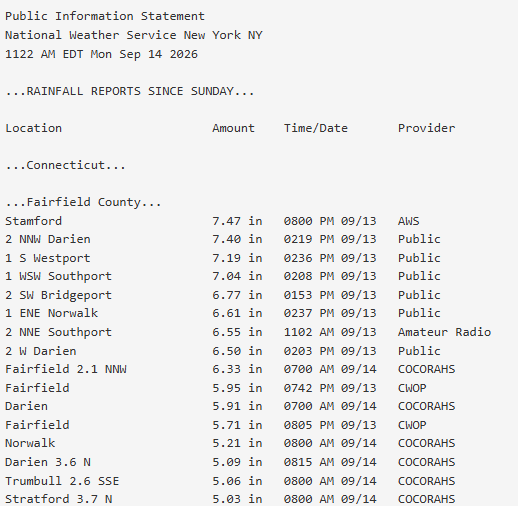
Stamford reported 7.47″ of rain, while just east near Darien, we had a 7.40″ report, and a 7.19″ report east of Norwalk in Westport, which was particularly hard hit. This is now the second significant flash flooding event since I moved here this summer. So you can say I am to blame, I suppose. But in all seriousness, this is not a laughing matter, and the Northeast has been a magnet for increasingly intense rainfall in recent years. 2026 is now the record holder in Bridgeport for number of hours that saw 1 inch of rain in an hour or more, at 5 of them. Folks on the Gulf Coast will read this and say “That’s cute,” but here in the Northeast, once you hit 1 inch per hour, that’s when serious problems can begin. Two of those hours came during the major January winter storm, another occurred on July 21st, a fourth on August 23rd, and the fifth on Sunday.
The two big ones on Sunday and back in July came as something of a surprise, in the sense that “Wow, I didn’t realize it rain that hard for that long.” But also in the sense that forecasts weren’t necessarily calling for 7 inches of rain. Even as the rain began Sunday morning, the NWS in New York City had called for locally higher amounts of 3 to 5 inches of rain in southern Connecticut. And a flood watch was indeed in place and had been for many hours prior to the onset of rain. The area was under a slight risk (level 2/4) for excessive rainfall.
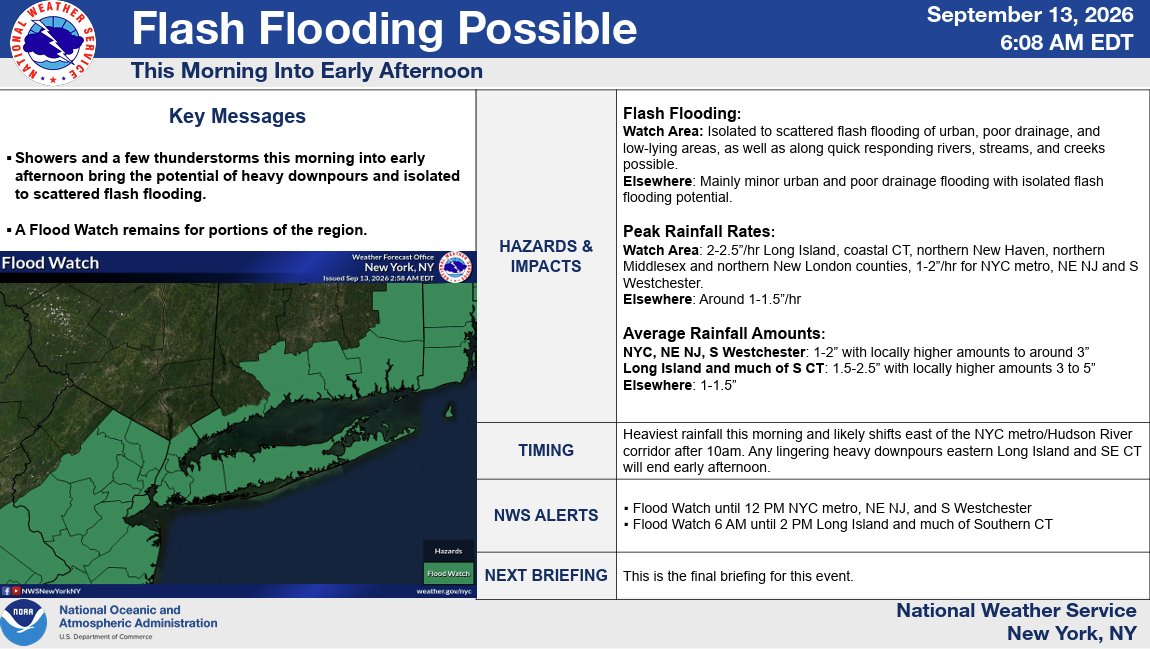
We have been under several flood watches this summer and 10 so far this year (compared to 5 in 2025 and 11 in 2024), so there may be an element of fatigue settling in, or the fact that it was on a weekend when folks were a little less tuned in may have also contributed to the surprising element. But short of underdoing the peak forecast totals a little, this was a pretty decent forecast. And there was good reason to believe that 5″+ totals were a distinct possibility in this area ahead of time.
Why is that? First, let’s look at the HREF/REFS details. The HREF probability matched mean product, which I have spoken highly of, showed 5 to 7 inches of rain possible over Long Island Sound on Saturday morning’s 12z run.
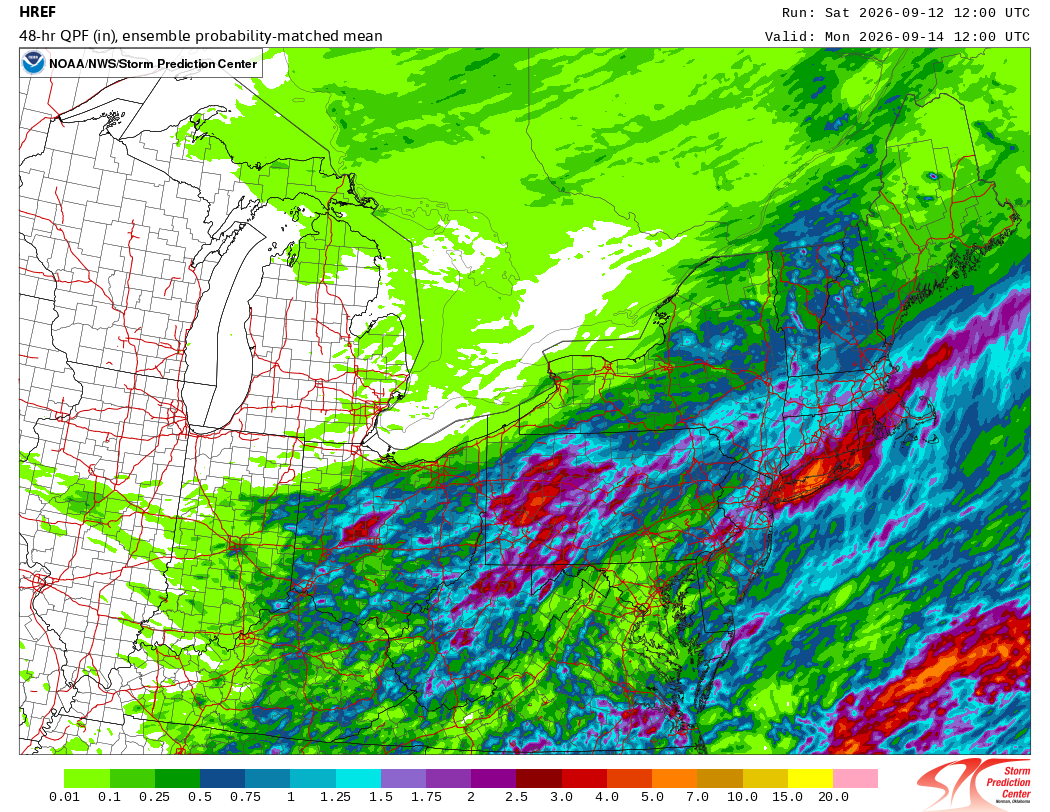
The max total of any one forecast in the ensemble did exceed 7 inches. Corroborating this was the REFS model which showed a healthy probability of 5 inches or more of rainfall over the same area highlighted above. So at the least, looking at this, some other data, and subsequent runs, it was evident that someone could see 5 inches or more of rainfall and they’d probably be adjacent to Long Island Sound.
You could have also looked at the NWS’s experimental urban rain rate dashboard (URRD) and seen at least some hints of a somewhat significant flooding event possible. While no point forecasts are available for southwest Connecticut, the Port Jefferson, Long Island location would have been helpful and instructive in this case.
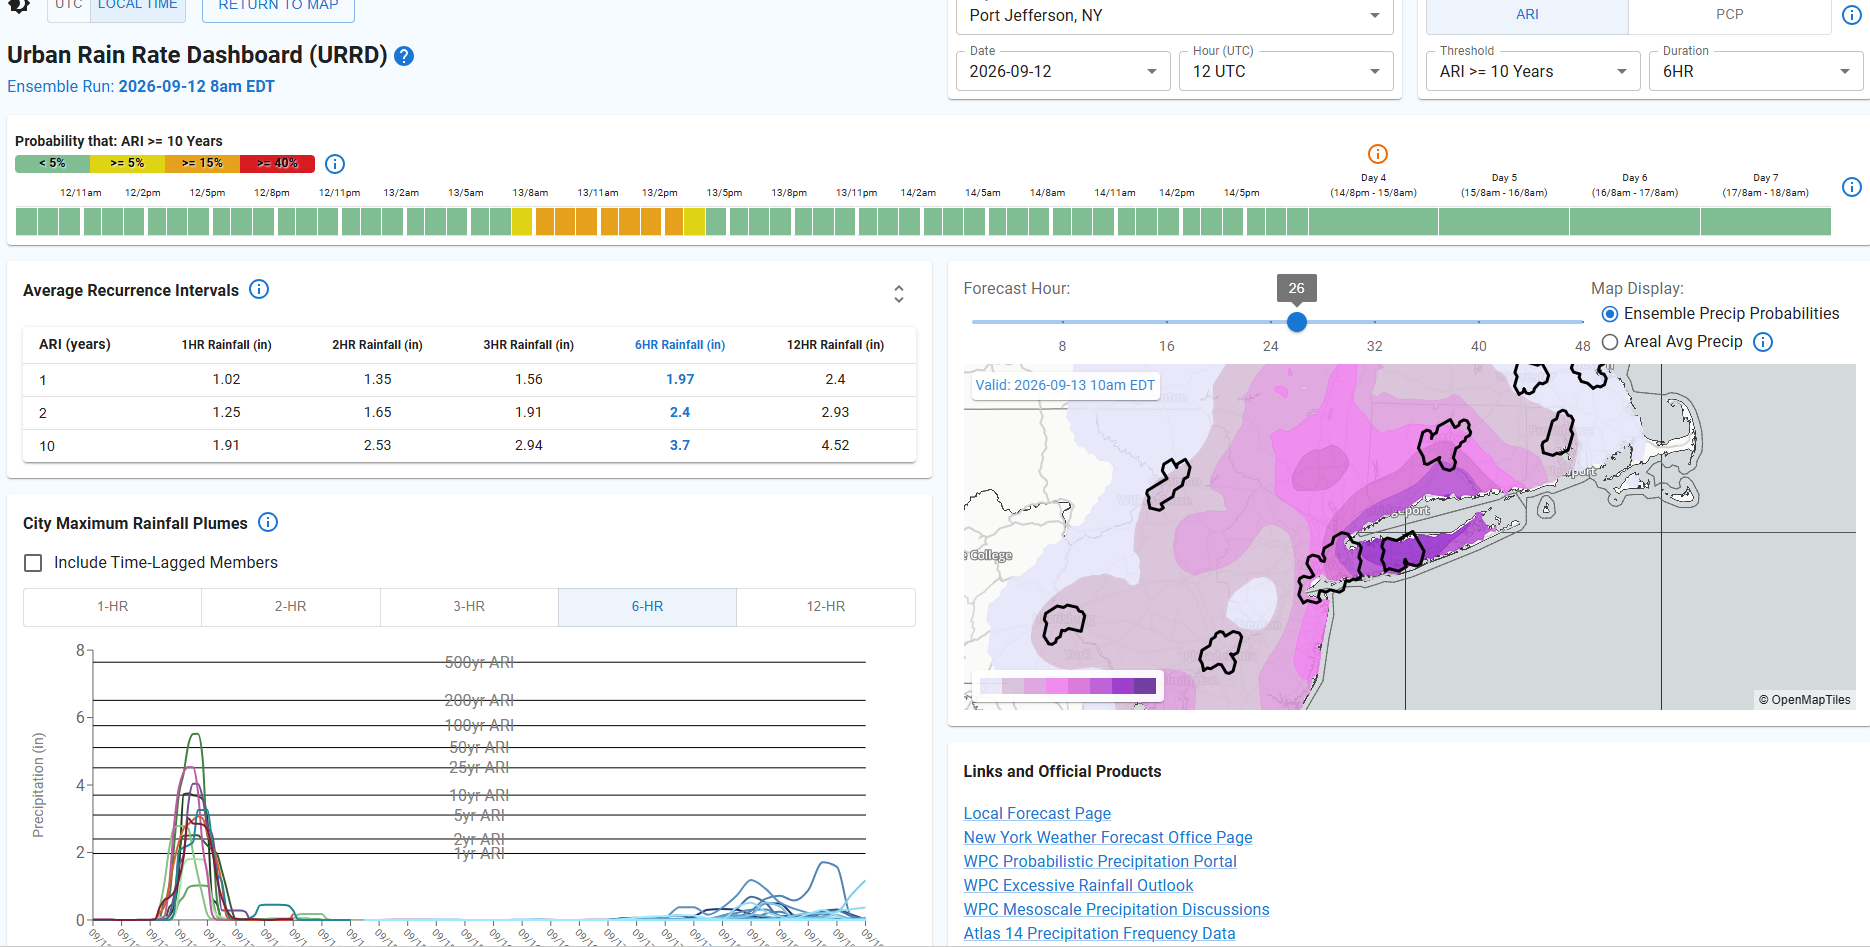
What can we pick out on here? Well, if we look at 6 hour rain totals, we can see that the ensemble probability of seeing a 6 hour average rainfall recurrence interval (ARI) of 10 years was significant. And even looking at the chart on the bottom left, there were several members of the plume in the 10, 25, or 50+ year ARI. The 10 year corresponds to about 3.4 to 4 inches over 6 hours. 50 to 100 year recurrence intervals would be between 5 and 6 inches. What ultimately fell was closer to a 200 to 500 year ARI. What does that mean in normal person language? It means that the rains that fell on Sunday typically only occur every 200 to 500 years in basically a static climate (based on NOAA Atlas 14 data which came out for New York and Connecticut over 10 years ago). We know that the climate is warming and able to hold more water vapor than when these ARIs were calculated, thus the true ARI is probably less than that by several years.
But the takeaway here? Modeling did an adequate job of predicting both the scope, coverage, and intensity of the rain if you were willing to buy in. Easier said than done sometimes, but I’d argue these tools do a pretty solid job in most instances. While the placement was imperfect, I can tell you as someone who lived in Houston for 14 years, it’s hard to do much better than that.