In brief: This post takes a look at how one specific tool we use performed during Edouard’s flooding overnight. The tool is slated to be decommissioned next month, but I want to highlight it as a success and one that perhaps should not be retired quite yet.
Overnight, terrible flooding played out in parts of East Texas. I hate the phrase “thankfully it occurred in a rural area,” because that devalues rural residents. You can read about what’s going on in that region here, but while it’s great that the toll wasn’t worse, it still impacted a number of folks northeast of Houston. Some will need support getting back to normal. Keep them in your thoughts.
Heavy rain is ongoing just north of those areas this evening, and overnight the focus should shift northward toward Lufkin or Palestine or Tyler, where modeling is indicating, again, the potential for double digit rainfall in some spots.
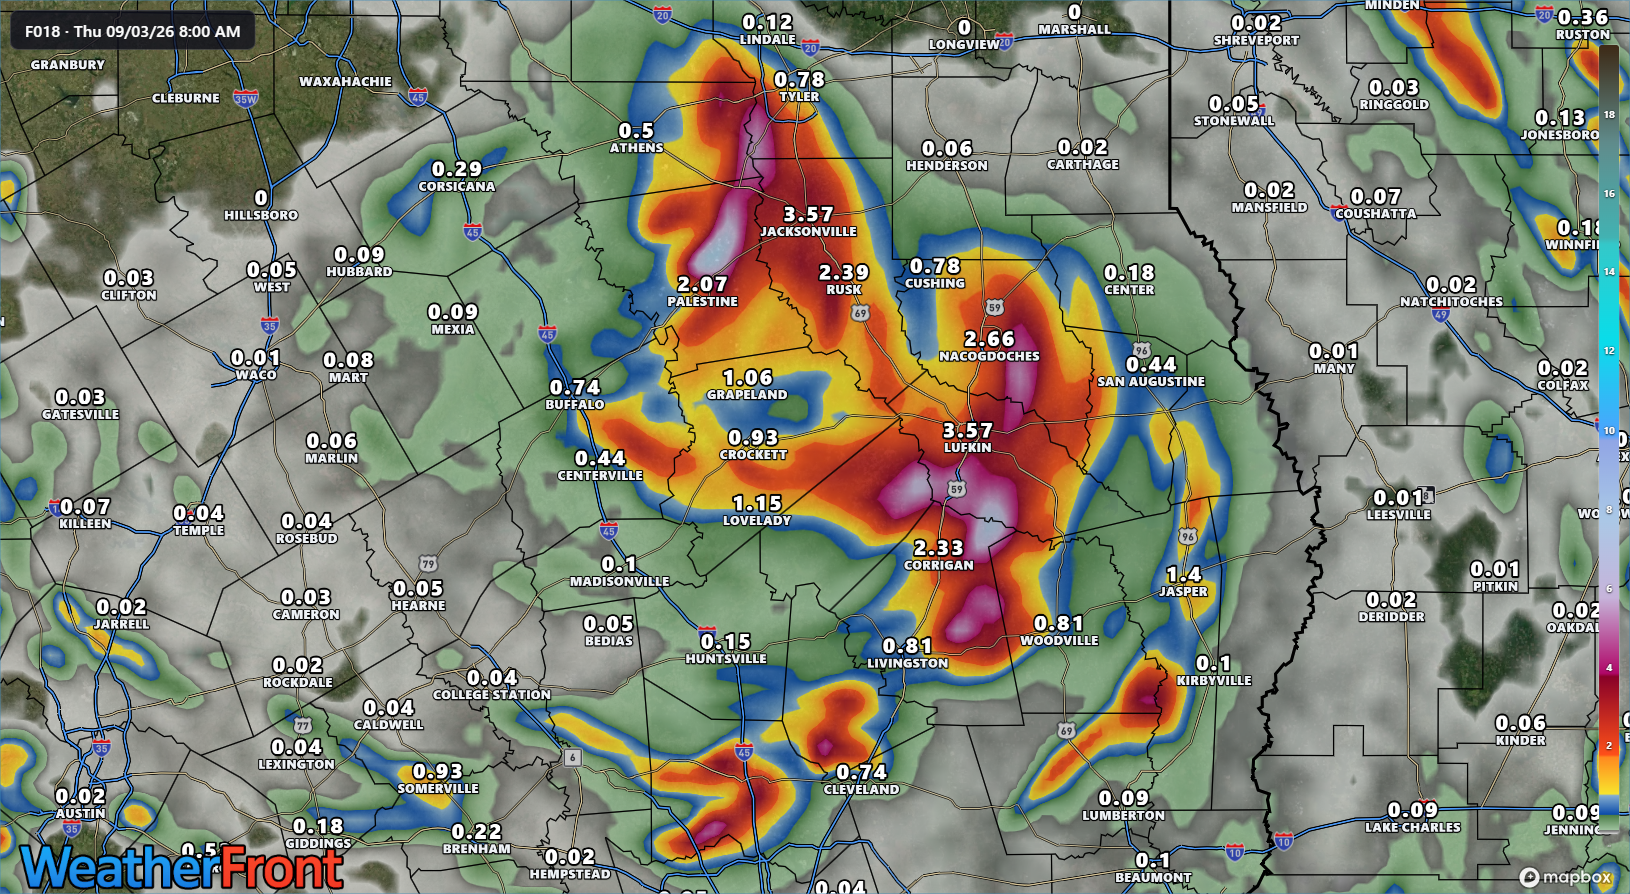
Here’s hoping the dry soils there help mitigate problems a bit.
Reality check: I’ve seen some conjecture by some prominent voices on social media about “brown ocean effect” possibly contributing to Edouard’s intense rains overnight. I highly doubt that was the case with Edouard, though we’ll see what researchers find. What is more likely the case is that Edouard did what many inland post-landfalling tropical storms do over Texas. There is what we call a “diurnal” cadence to thunderstorm development in these storms. You can go in depth on the mechanics of how this all works through various Google searches (I’ve yet to find a great link to share), but in a nutshell: Hurricanes and tropical storms are heat engines. They act to transfer heat energy from the tropics to the higher latitudes. So at night, as the upper atmosphere cools off, you are left with this gigantic (or in Edouard’s case, somewhat horizontally challenged) storm and a growing degree of atmospheric instability, thanks in part to the growing temperature gradient between the cooling atmosphere and warmer core storm. Add in a wide open gate to a hotter than normal Gulf of Mexico, and you have the recipe for torrential, efficient rain producers. This was one reason why we were quite bulled up about rain risk last night.
The brown ocean effect implies that a storm is literally gaining energy because the ground is so saturated that it’s acting like a marsh or bay. This was absolutely not the case in East Texas last night in my opinion. Edouard was not actually intensifying. It was producing better organized tropical rains at a very efficient rate, similar to previous storms like Imelda, Harvey, or Allison. Well-documented physical processes are cooler than cool-sounding terminology.
We’re retiring the HREF model. Should we be?
I want to dig into the weeds a bit here. Earlier this year, NOAA announced that a slew of modeling would be discontinued, ostensibly because it requires a good deal of computational power that is rapidly becoming outdated and inefficient. On its merits, it’s a reasonable decision. And it is one we have known was coming. One of the modeling products slated for decommissioning is the HREF, or high resolution ensemble forecast system. It’s to be replaced by a newer version, the rapid refresh (RRFS) ensemble forecast system, or REFS. All of this is scheduled to occur on October 6th.
I raise this point for a very specific reason. First of all, let’s take a look at what both the older HREF and newer REFS showed for probability of 5″ or more of rainfall with Edouard from 8 AM Tuesday through 8 AM Wednesday.
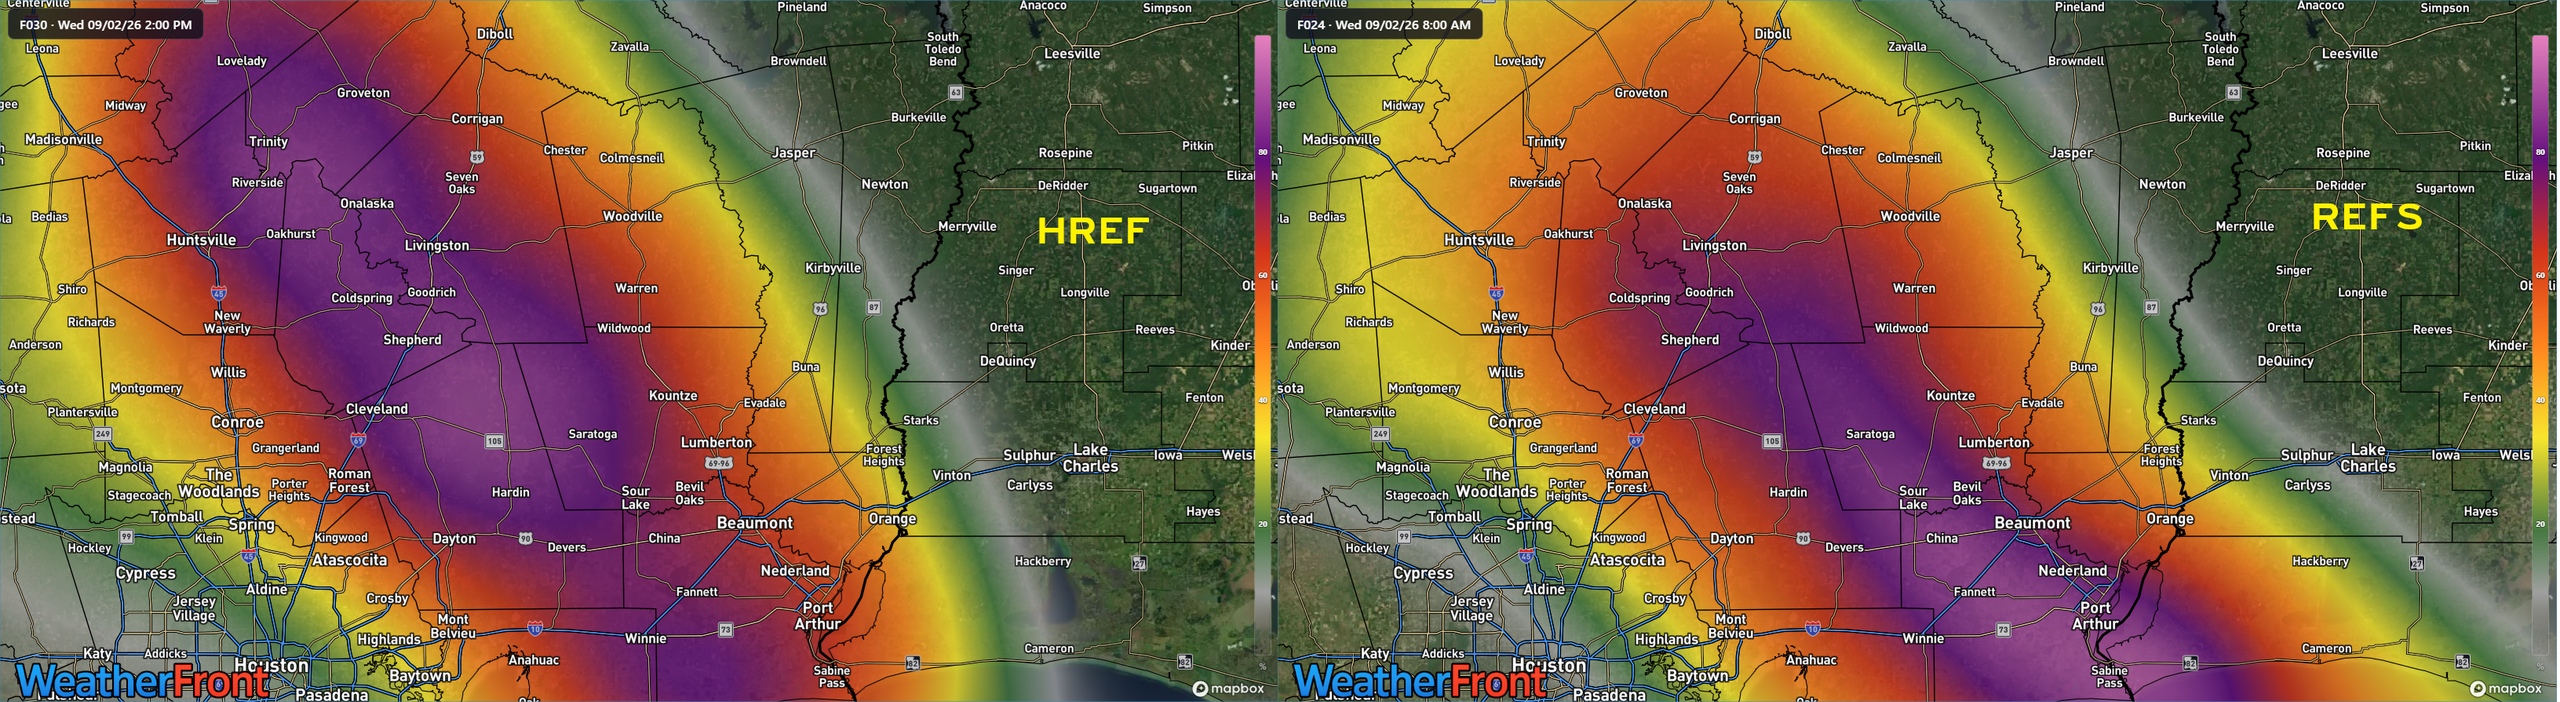
Both indicated a good probability of 5″ or more somewhere in the corridor between Trinity, TX and Sabine Pass. Fair enough. Let’s see what their ensemble mean rainfall forecasts were for the same period at the same initialization time.
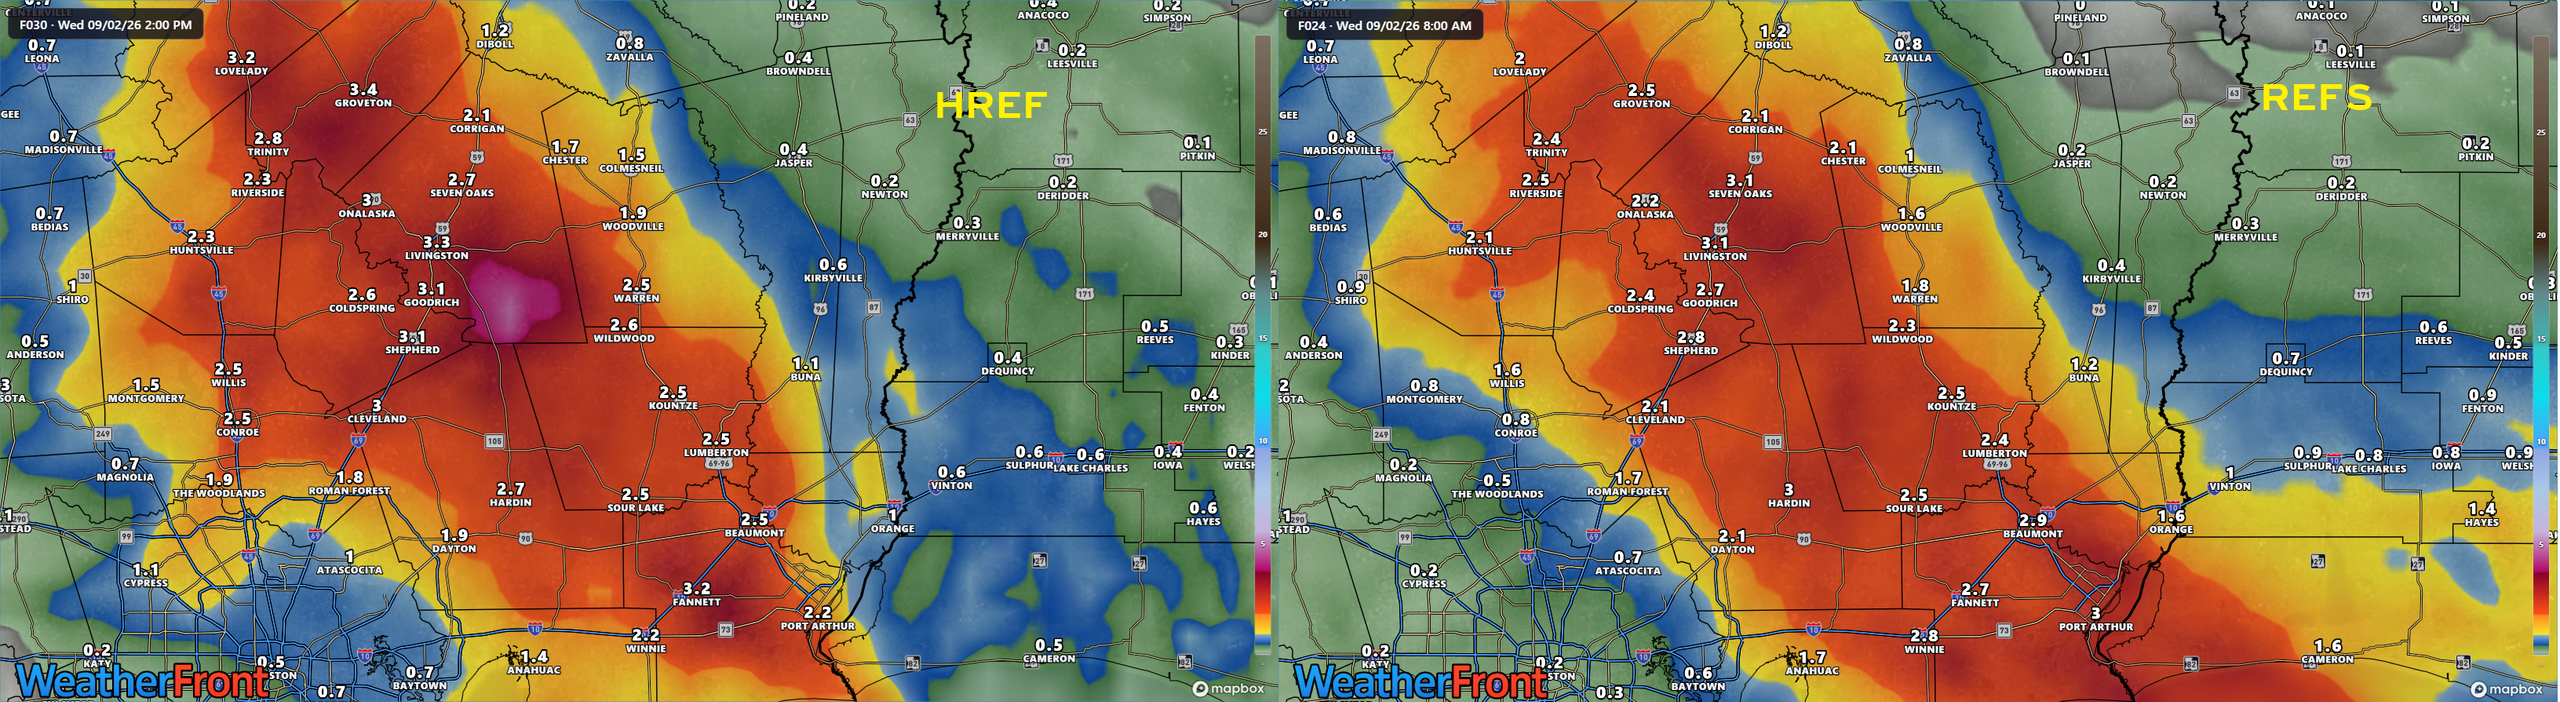
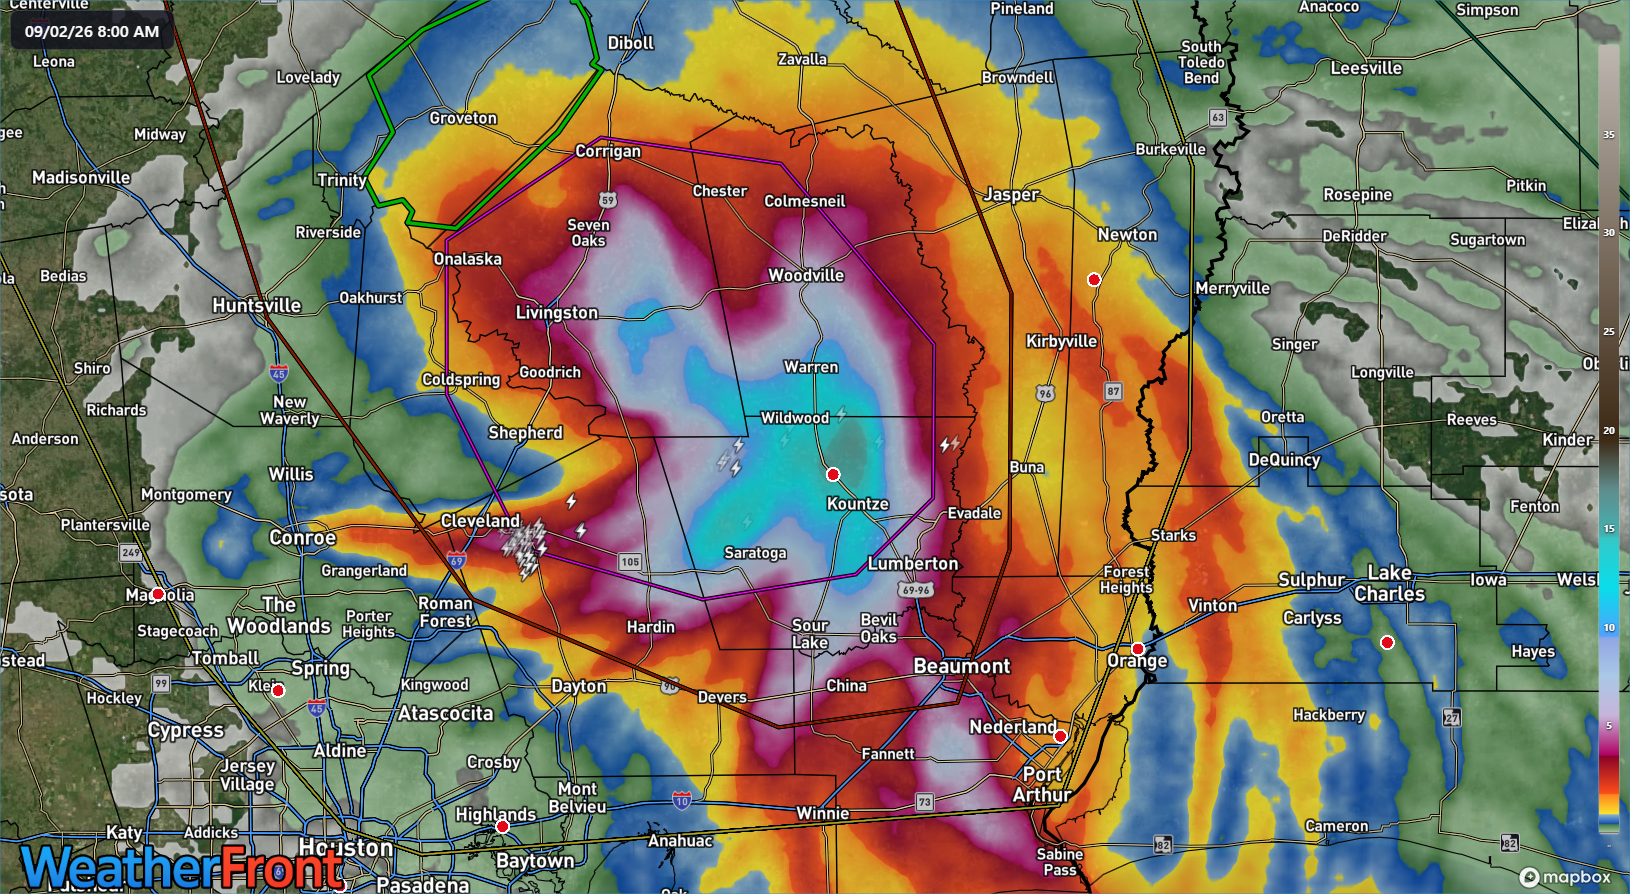
In this instance, the HREF actually outperformed the REFS in terms of indicating, explicitly 5″+ of rain in the forecast in a small area near Lake Livingston. This actually ended up being not too far off the bullseye of the final tally as of 8 AM.
Now, if you used the actual operational RRFS at 12z (same initialization time as the models above) for the rain risk overnight, you saw a much more aggresssive story.
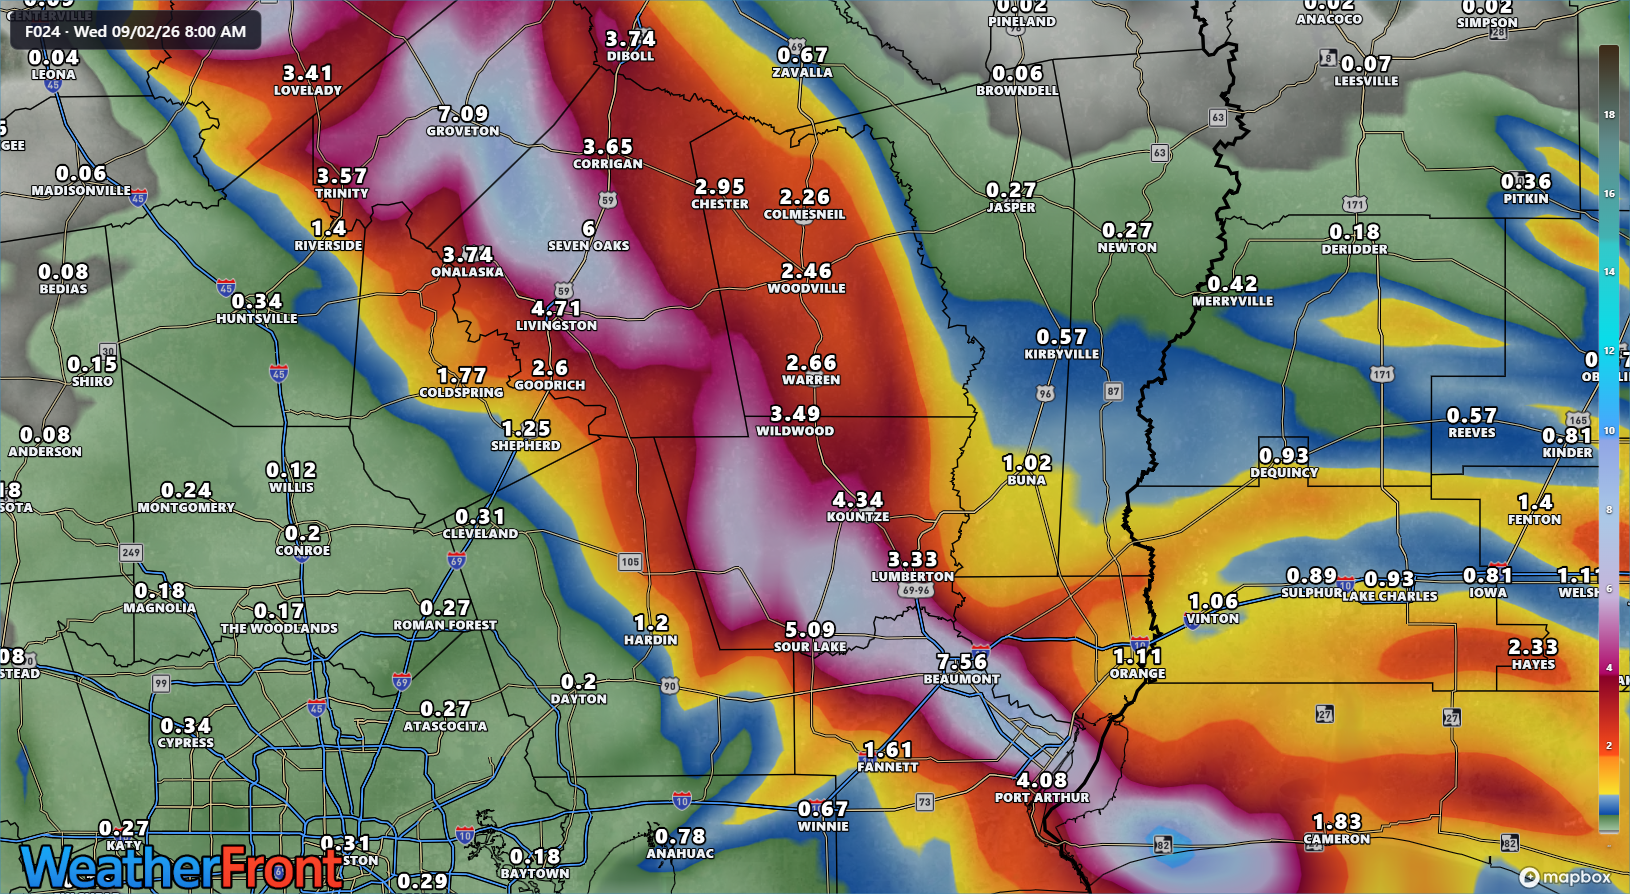
This indicated at least the risk of double digit total rainfall, perhaps up to 10 inches.
Within the HREF there is a product called “probability matched mean” and “local probability matched mean.” It is defined as this:
Conceptually, PMM (probability-matched mean) is a variation of the ensemble mean with the original ensemble amplitude restored. At each grid point, the ensemble mean value is replaced with a value from the full distribution of individual member forecasts whose rank matches the point’s rank within the ensemble mean distribution.
LPMM (localized PMM) is a new technique from Clark (2017, WAF) wherein the PMM calculation is restricted to grid points inside some radius of influence, preventing precipitation in geographically distant areas from influencing the local value. On this site, we use r=110 km.
I recognize for most of our readers that’s a whooooooole lotta jargon. In brief: It’s another tool that we as meteorologists use to gauge how much rain may fall in a given location. Or what the maximum potential is in a situation where it could be realized, such as, say, in a landfalling tropical storm. Here’s what that LPMM product showed us yesterday after the same 12z run we have above.
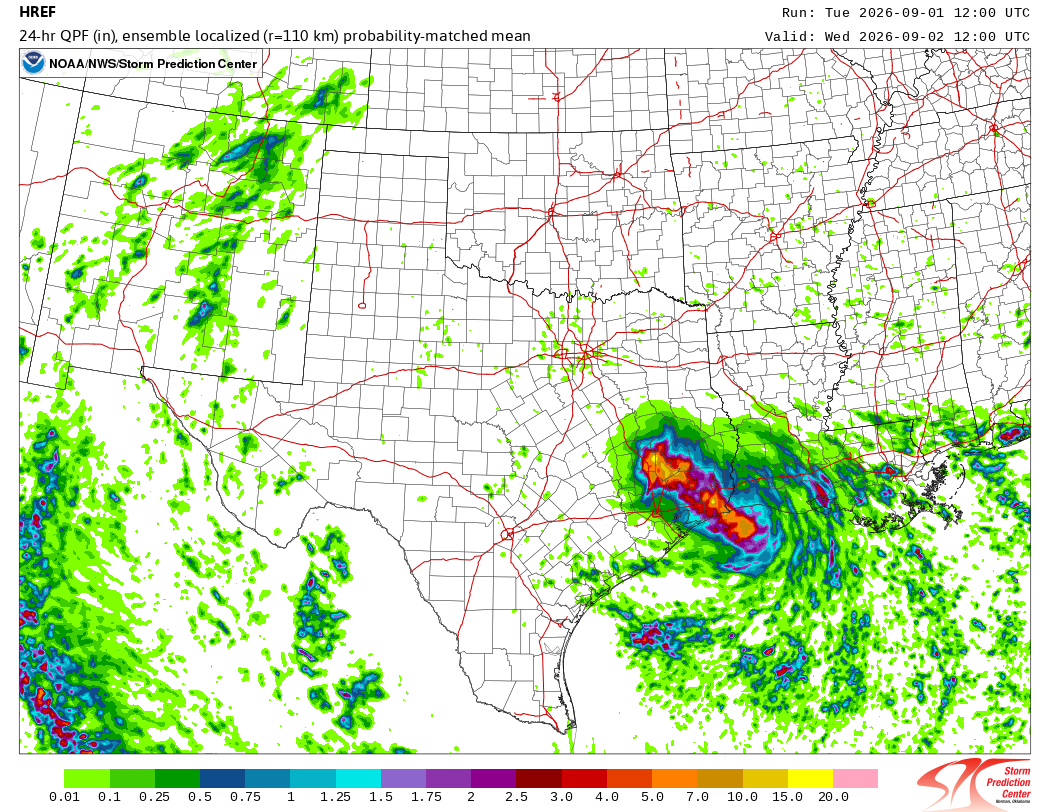
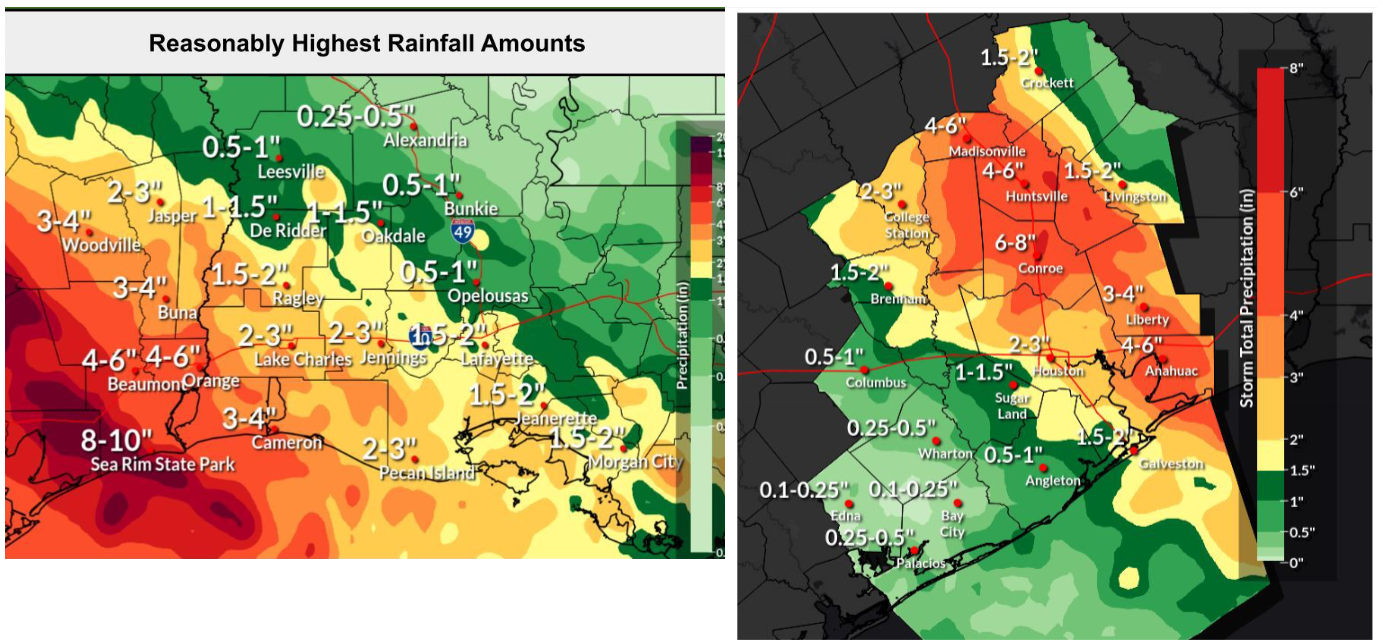
In that particular product, it shows that there was potential for 10 to 15 inches of rain or even more in the 24 hours ending this morning. Now compare that to the actualized rainfall map above. It did somewhat poorly on placement. But if you were a meteorologist looking at the forecast on Tuesday morning for the rainfall after Edouard made landfall, you had a really important data point from the LPMM. Not to throw anyone under the bus here, but no one’s rainfall forecast was particularly great overnight for East Texas. Here were some of the NWS forecast rainfall graphics from yesterday morning I cobbled together from social media.
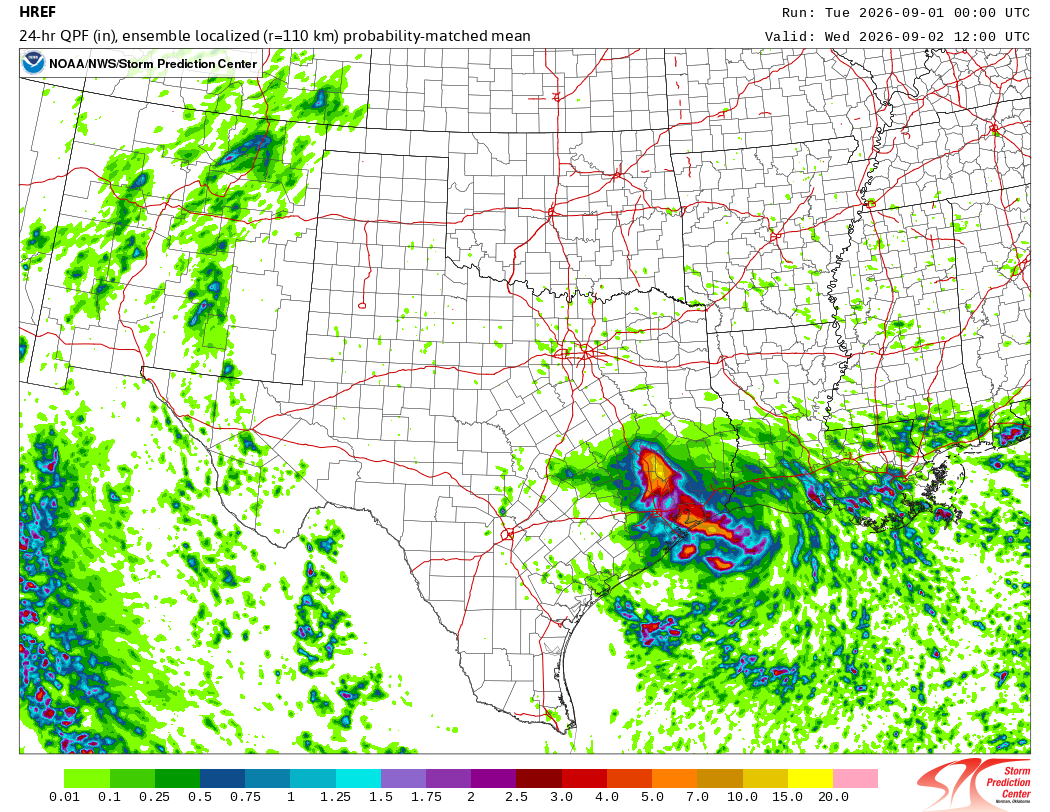
The signal in the LPMM product was consistent enough though. Even on Monday night’s run it showed potential for 10-15″ of rain near or just southeast of Lake Livingston.
Astute readers might have noticed I included this in yesterday morning’s post.
This is somewhat speculative on my part, but the remnant center of Edouard should be in the Brazos Valley tonight, near Huntsville or Madisonville. We sometimes see the centers of these things try to pop up more numerous thunderstorms than forecast during the diurnal peak in convection overnight (the propensity for tropical systems to peak their thunderstorm activity in the overnight hours). There could be a localized flooding threat somewhere up near Huntsville, Madisonville, or Centerville overnight, so just be aware of that.
And this in yesterday evening’s post.
As we go through tonight, the heaviest rain will fall near the track of Edouard inland. That is currently expected to work toward Lake Livingston in southeast Texas and perhaps toward the Huntsville area. Depending on the exact track, we could see a period of torrential rainfall after midnight near the center of Edouard or just to the southeast. I mentioned this earlier this morning as a possibility, but I am more concerned about this now after looking at the latest model data. This does not include the Houston metro. This should theoretically line up somewhere between Crockett, Huntsville, and Lake Livingston. This is the area I am most concerned about with regard to flash flooding tonight. Some of the higher resolution modeling we use shows potential for 5 to 10 inches or even more of rain in that area, particularly near Lake Livingston.
Let me be clear here that I’m not self-aggrandizing. But one of the tools I always, always, always look at ahead of heavy rain events is the HREF’s PMM or LPMM product. In conjunction with other forecast data, it allows me and other forecasters to better understand the risk environment we’re in.
Progress is progress, and NOAA has been clear that these tools are heading for decommissioning. However, I know I am not the only forecaster that uses these tools regularly.
Many years ago, when I was early in my career, we had a model called the NGM model. It stood for Nested Grid Model. Several of us, the author here included, joked that NGM stood for “No Good Model.” It had exceeded the end of its useful life by the early 2000s when the ETA and AVN models were upgraded to the NAM and GFS models. Those models were superior in almost every way, and most forecasters saw that, so the NGM was retired. And yes, a few people pushed back. Change is inevitable. But I’m not sure the forecast community has gotten the reassurance it needs from NOAA.
There’s a case for reducing output because it’s inefficient. I worry that the momentum and pressure to forge forward comes at the expense of targeted forecast situations where that output excels (like last night). I’m sure I’ll hear from folks at NOAA about this that it’s been tested and is good and the NWS forecasters have been using it regularly. And that’s great. I have heard many good things about what’s coming. But remember, as non-government operational forecasters, as users every day of this stuff to communicate to the public, we are the ones who need to see the products regularly before we can just adopt them and take everyone at their word. Statistical analyses are important, but they do not factor in day-to-day operational utility or forecaster comfort of using a tool. Certain models may be “better” or “good,” but that does not instantly deem them useful.
The phrase in statistics is that “all models are wrong. Some models are useful.” And when you get a useful model, even if it’s a little outdated, you should probably hang on to it for as long as you can.